The Nutanix Cloud Bible
The purpose of The Nutanix Cloud Bible is to provide in-depth technical information about the Nutanix platform architecture and how it can enable smooth operations across cloud, edge, and core environments.
» Download this section as PDF (opens in a new tab/window)
In the following sections we’ll cover some key features that are part of Nutanix Intelligent Operations.
NOTE: Not all features are currently covered. In this section, we currently cover:
Stay tuned for updates for the rest of the features in Intelligent Operations:
In the world of IT operations there is a lot of noise. Traditionally systems would generate a great deal of alerts, events and notifications, often leading to the operator either a) not seeing critical alerts since they are lost in the noise or b) disregarding the alerts/events.
With the Anomaly Detection feature of Intelligent Operations, the system will monitor seasonal trends for time-series data (e.g. CPU usage, memory usage, latency, etc.) and establish a “band” of expected values. Only values that hit outside the “band” will trigger an event / alert. You can see the anomaly events / alerts from any entity or events page.
The following chart shows a lot of I/O and disk usage anomalies as we were performing some large batch loads on these systems:
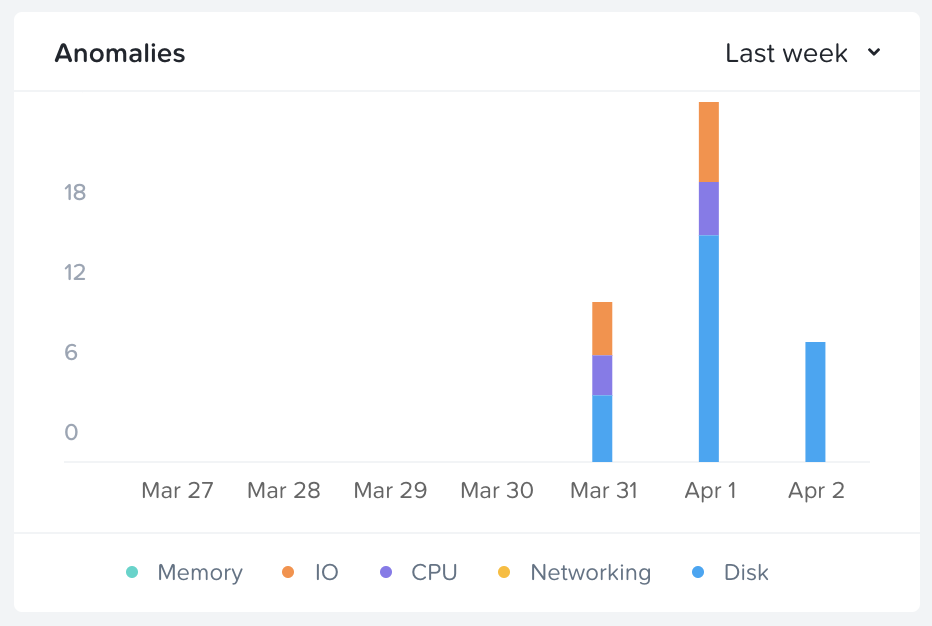 Anomaly Chart
The following image shows the time-series values for a sample metric and the established “band”:
 Anomaly Band
This reduces unnecessary alerts as we don’t want alerts for a “normal” state. For example, a database system will normally run at >95% memory utilization due to caching, etc. In the event this drops to say 10% that would be an anomaly as something may be wrong (e.g. database service down).
Another example would be how some batched workloads run on the weekend. For example, I/O bandwidth may be low during the work week, however on the weekends when some batch processes run (e.g. backups, reports, etc.) there may be a large spike in I/O. The system would detect the seasonality of this and bump up the band during the weekend.
Here you can see an anomaly event has occured as the values are outside the expected band:
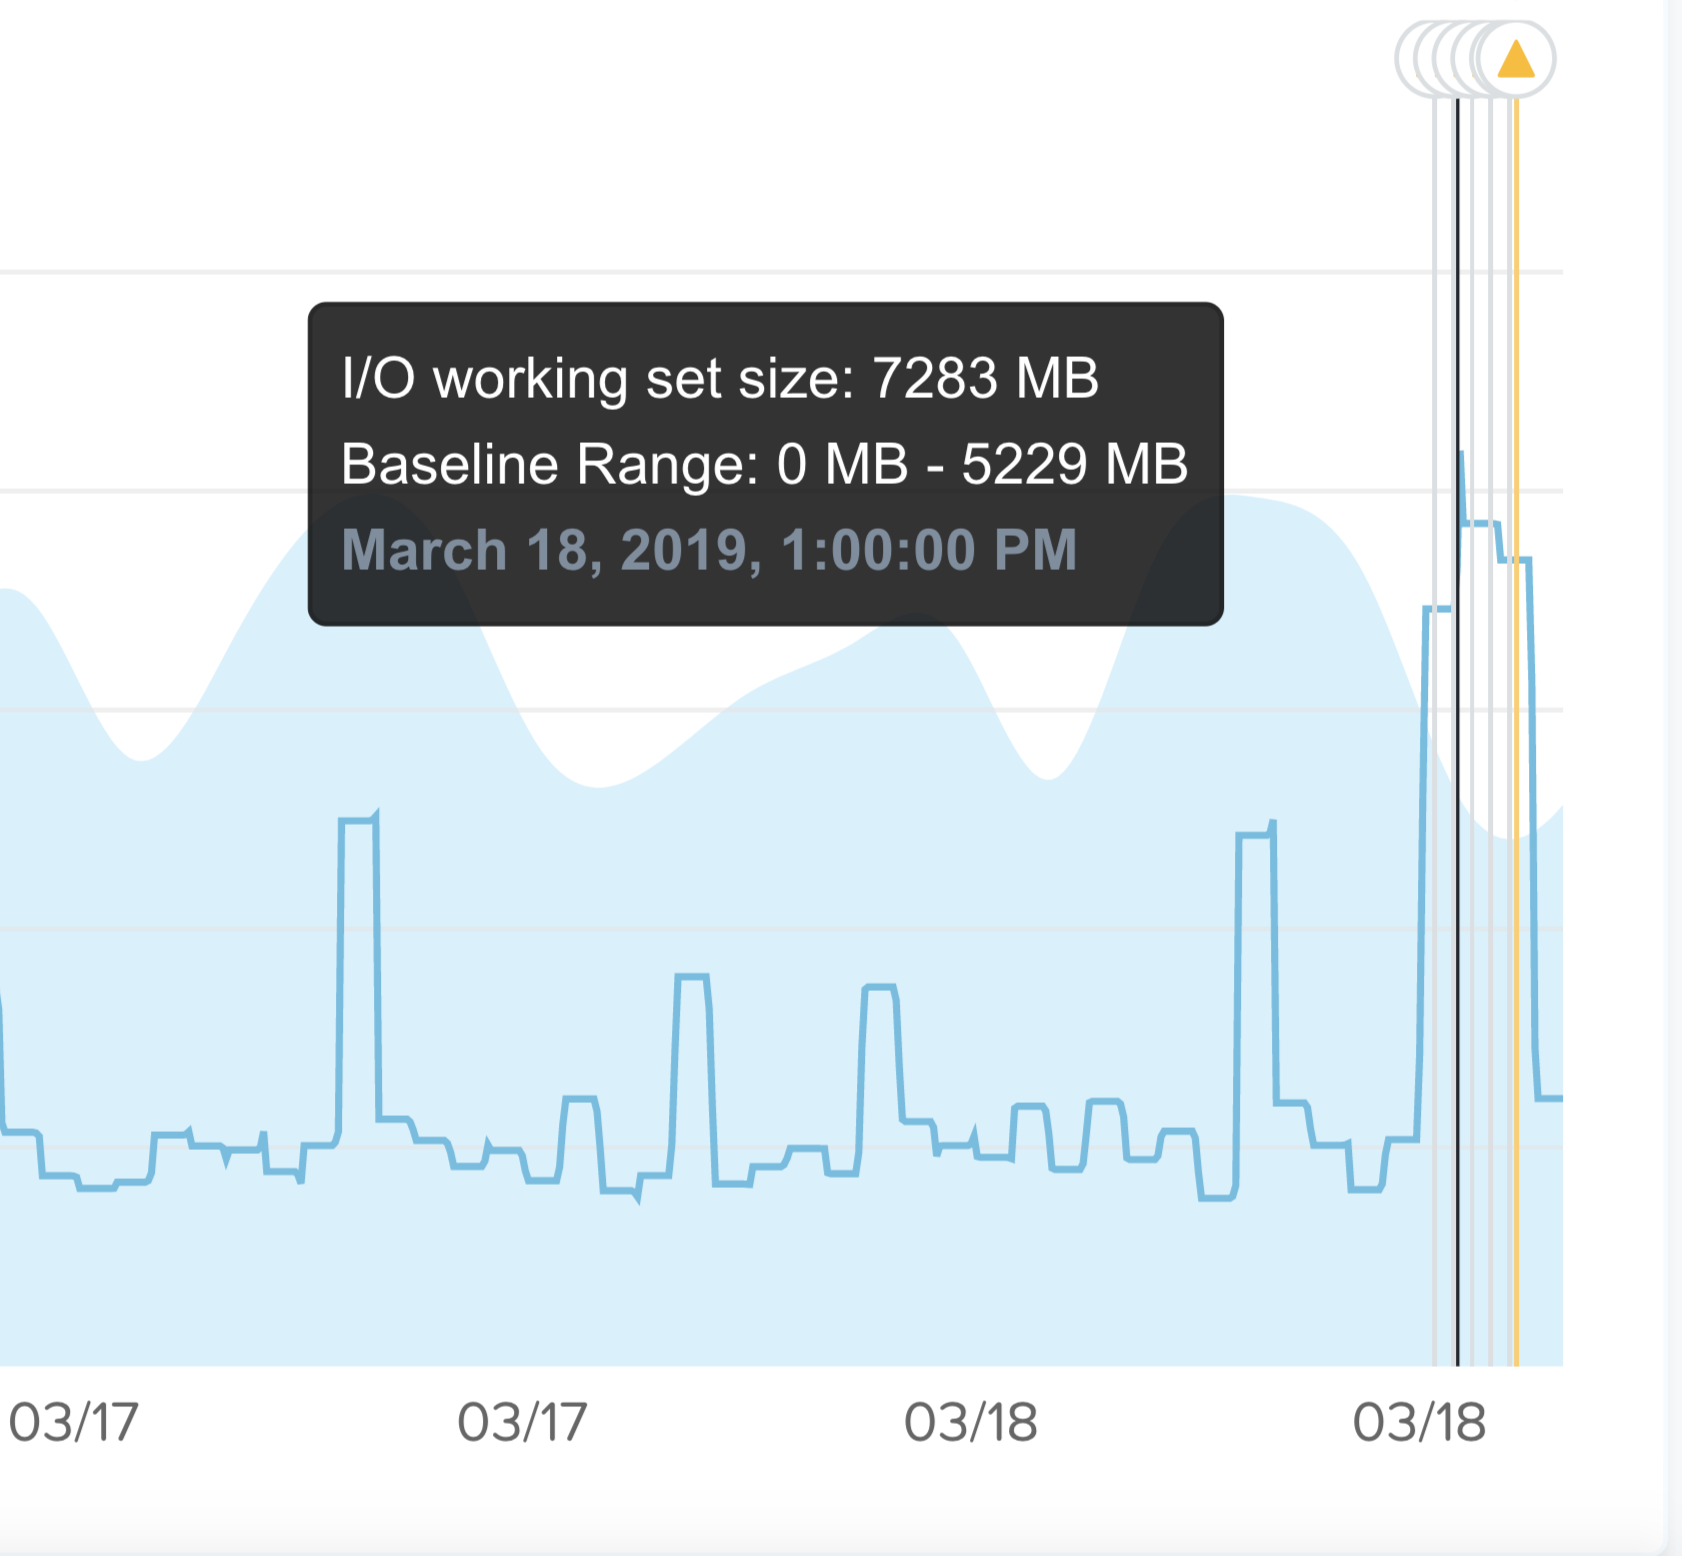 Anomaly Event
Another topic of interest for anomalies is seasonality. For example, during the holiday period retailers will see higher demand than other times of the year, or during the end of month close.
Anomaly detection accounts for this seasonality and leverages the following periods to compare between micro (daily) and macro (quarterly) trends:
You can also set your own custom alerts (also called user-defined alerts), that enables you to alert on behavioral anomalies or static thresholds:
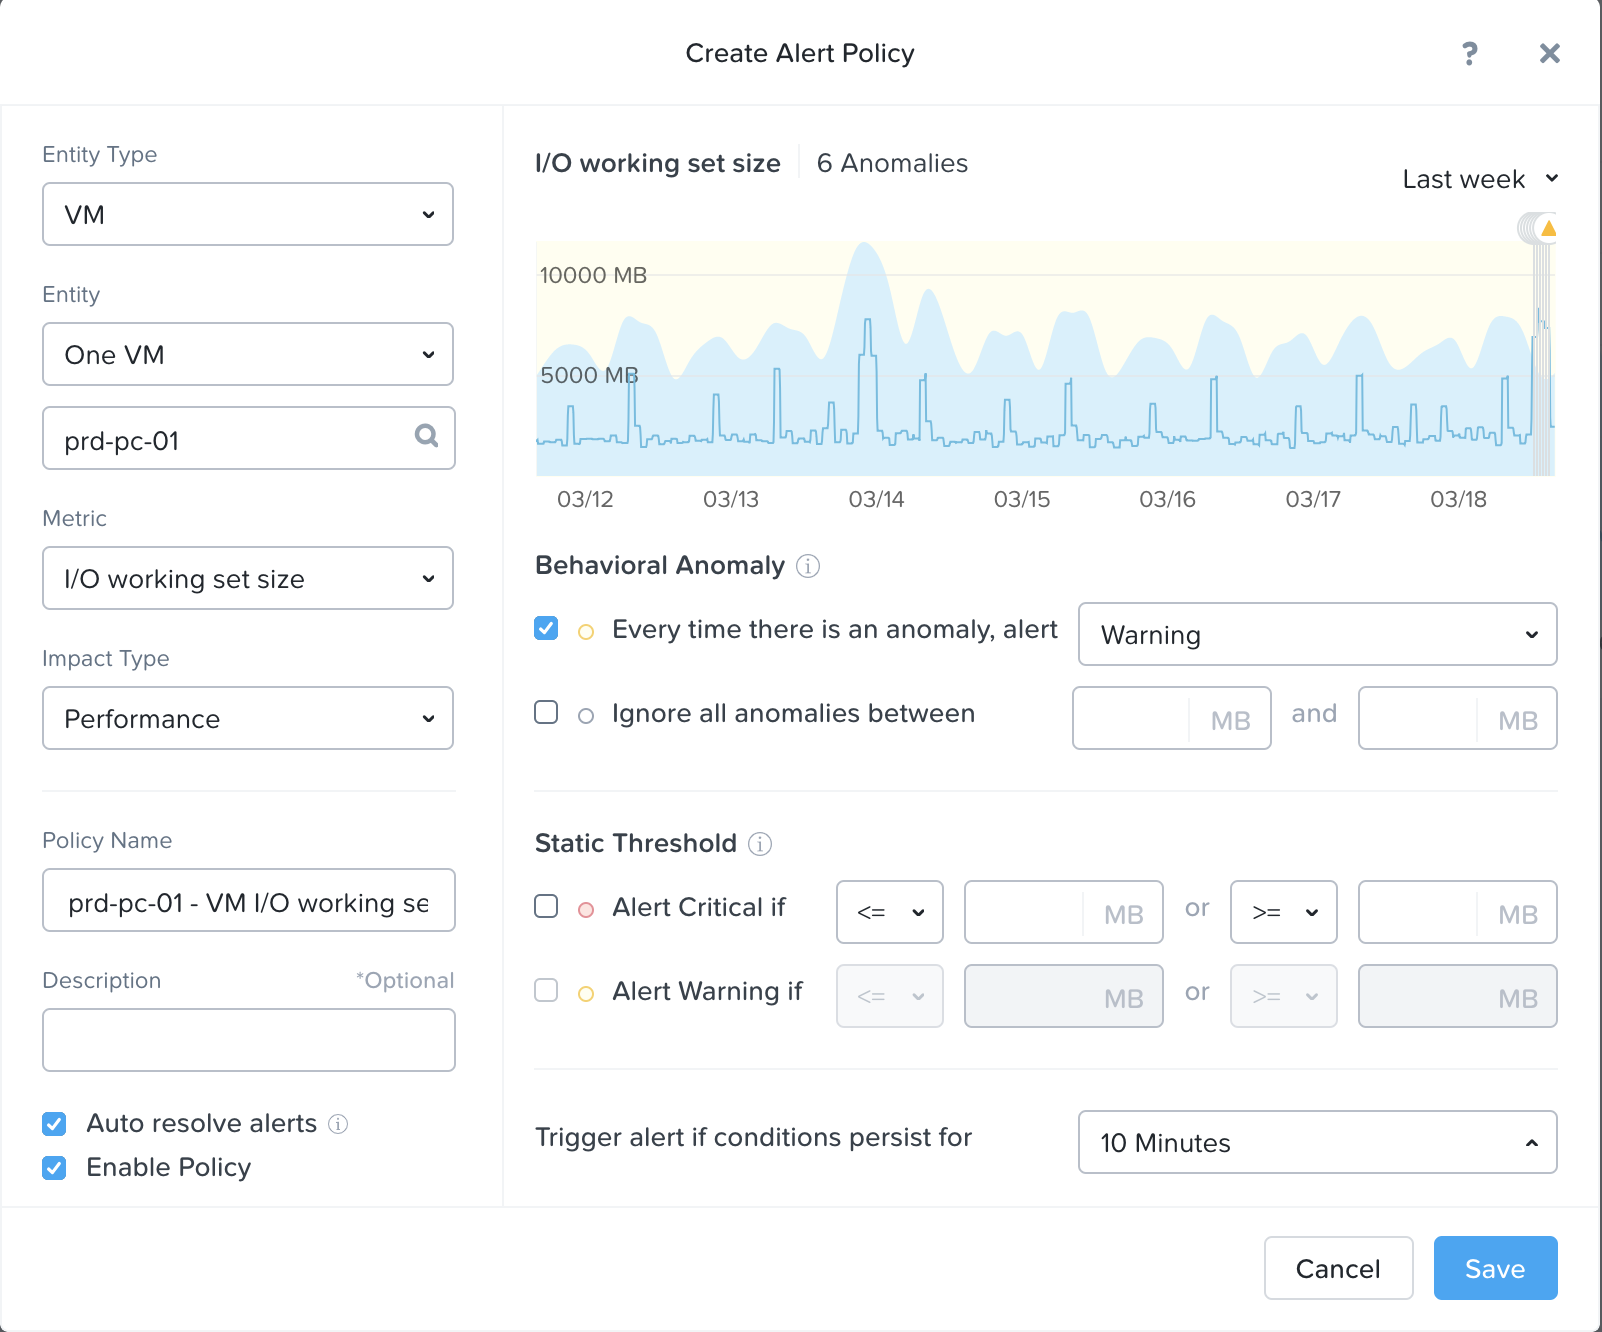 Anomaly Custom Event
Nutanix leverages a method for determining the bands called 'Generalized Extreme Studentized Deviate Test'. A simple way to think about this is similar to a confidence interval where the values are between the lower and upper limits established by the algorithm.
The algorithm requires 3 x the granularity (e.g. daily, weekly, monthly, etc.) to calculate the seasonality and expected bands. For example, the following amounts of data would be required to adapt to each seasonality:
Twitter has a good resource on how they leverage this which goes into more detail on the logic: LINK
To get detailed capacity planning details you can click on a specific cluster under the ‘cluster runway’ section in Prism Central to get more details:
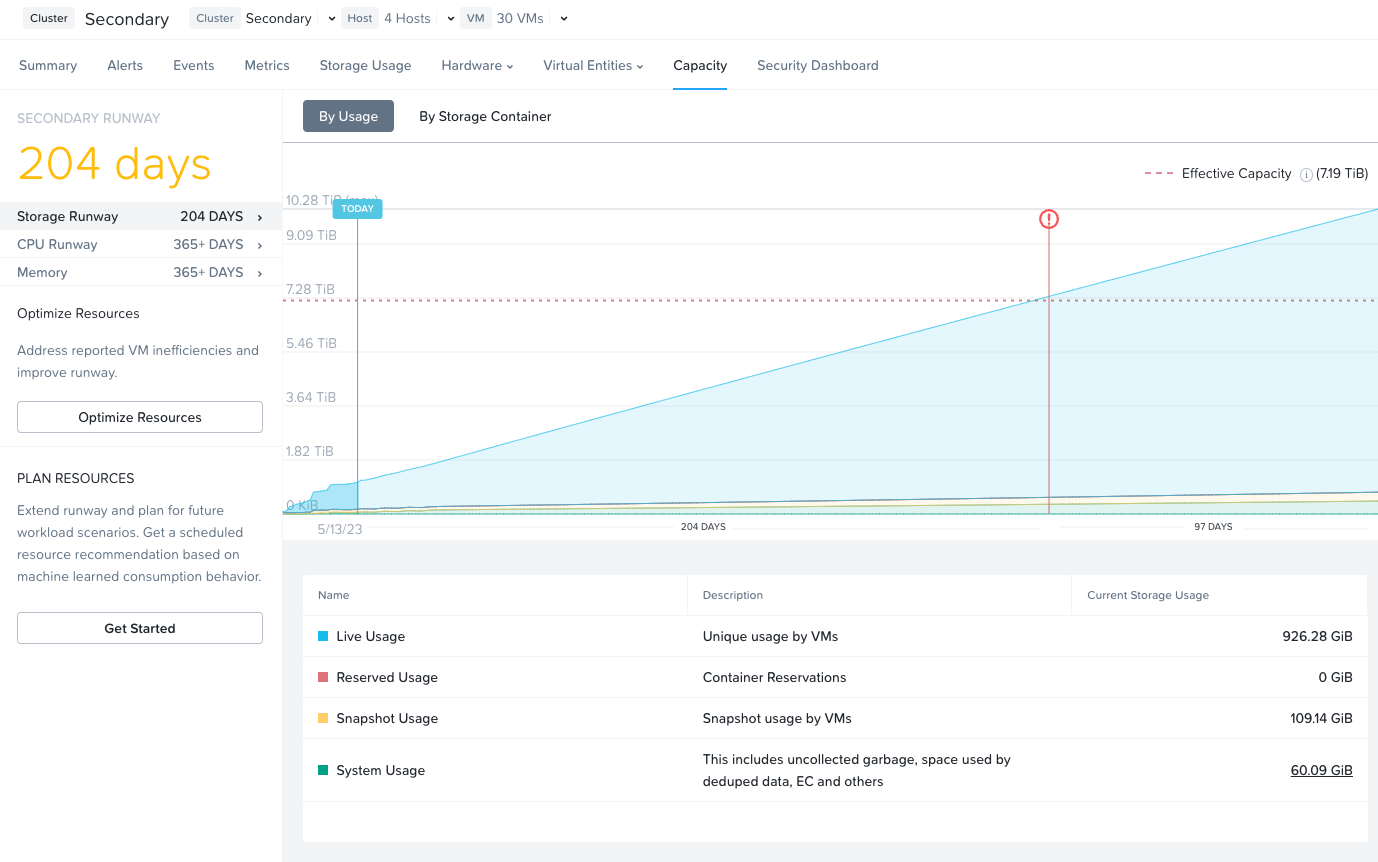 Capacity Planning
This view provides detailed information on cluster runway and identifies the most constrained resource (limiting resource). You can also get detailed information on what the top consumers are as well as some potential options to clean up additional capacity or ideal node types for cluster expansion.
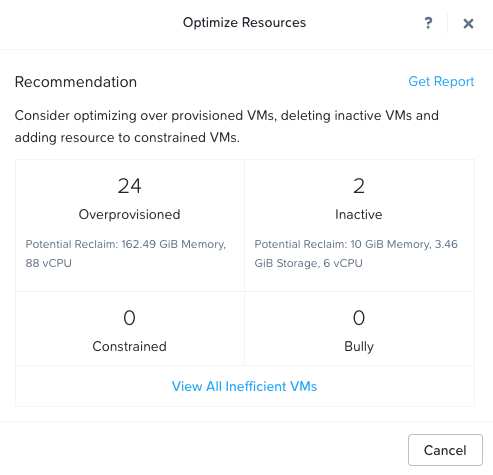 Capacity Planning - Recommendations
When we think about our daily activities the more we can automate the better. We are constantly doing this in our daily lives with our routines and technology enables us to do the same in other areas. Nutanix X-Play (pronounced CrossPlay) allows us to automate a common set of activities. However, before diving into the product, let’s first cover what we’re trying to do.
Event driven automation works in the following manner:
event(s) → logic → action(s)
In this scenario there’s some sort of event (or cascading events) that occur which triggers a series or set of actions. A great example of this is IFTTT which takes an event, applies some logic (hence the ‘if this then that’ acronym), then performs some action.
For example, take turning off the lights at home when we leave. If we can program the event (e.g. leaving home / device not present) to trigger the system to turn off all the lights automatically, that makes our lives much simpler.
If we compare this to our IT operations activities we see a similar pattern. An event occurs (e.g. a VM needs more disk space) and then we perform a series of actions (e.g. create a ticket, add storage, close ticket etc.). These repetitive activies are a perfect example of where automation can add value and enable us to focus on more beneficial activities.
With X-Play we can take a series of events / alerts and allow the system to intercept those and perform a series of actions.
To get started navigate to the ‘Plays’ section under ‘Operations’ in the Infrastructure menu:
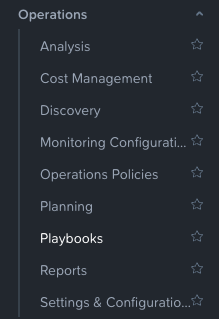 X-Play - Navigation
This will launch the main X-Play page:
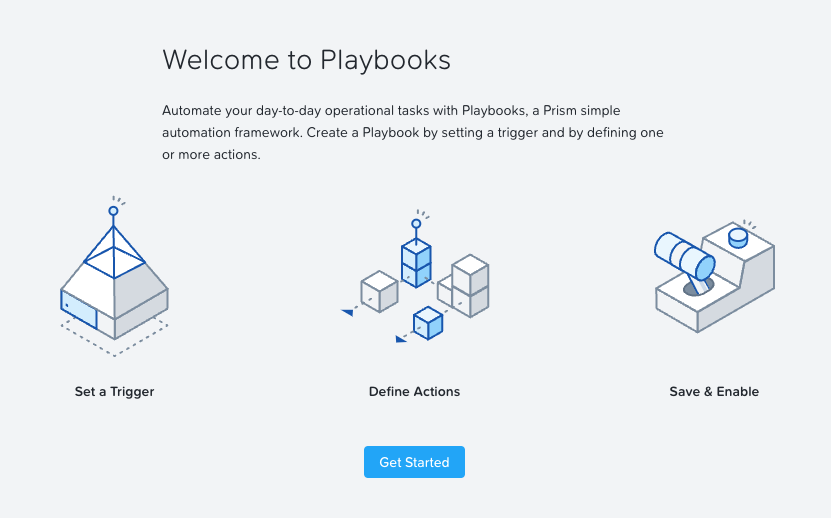 X-Play - Playbooks Overview
Click on ‘Get Started’ to view the current plays and/or create a new one:
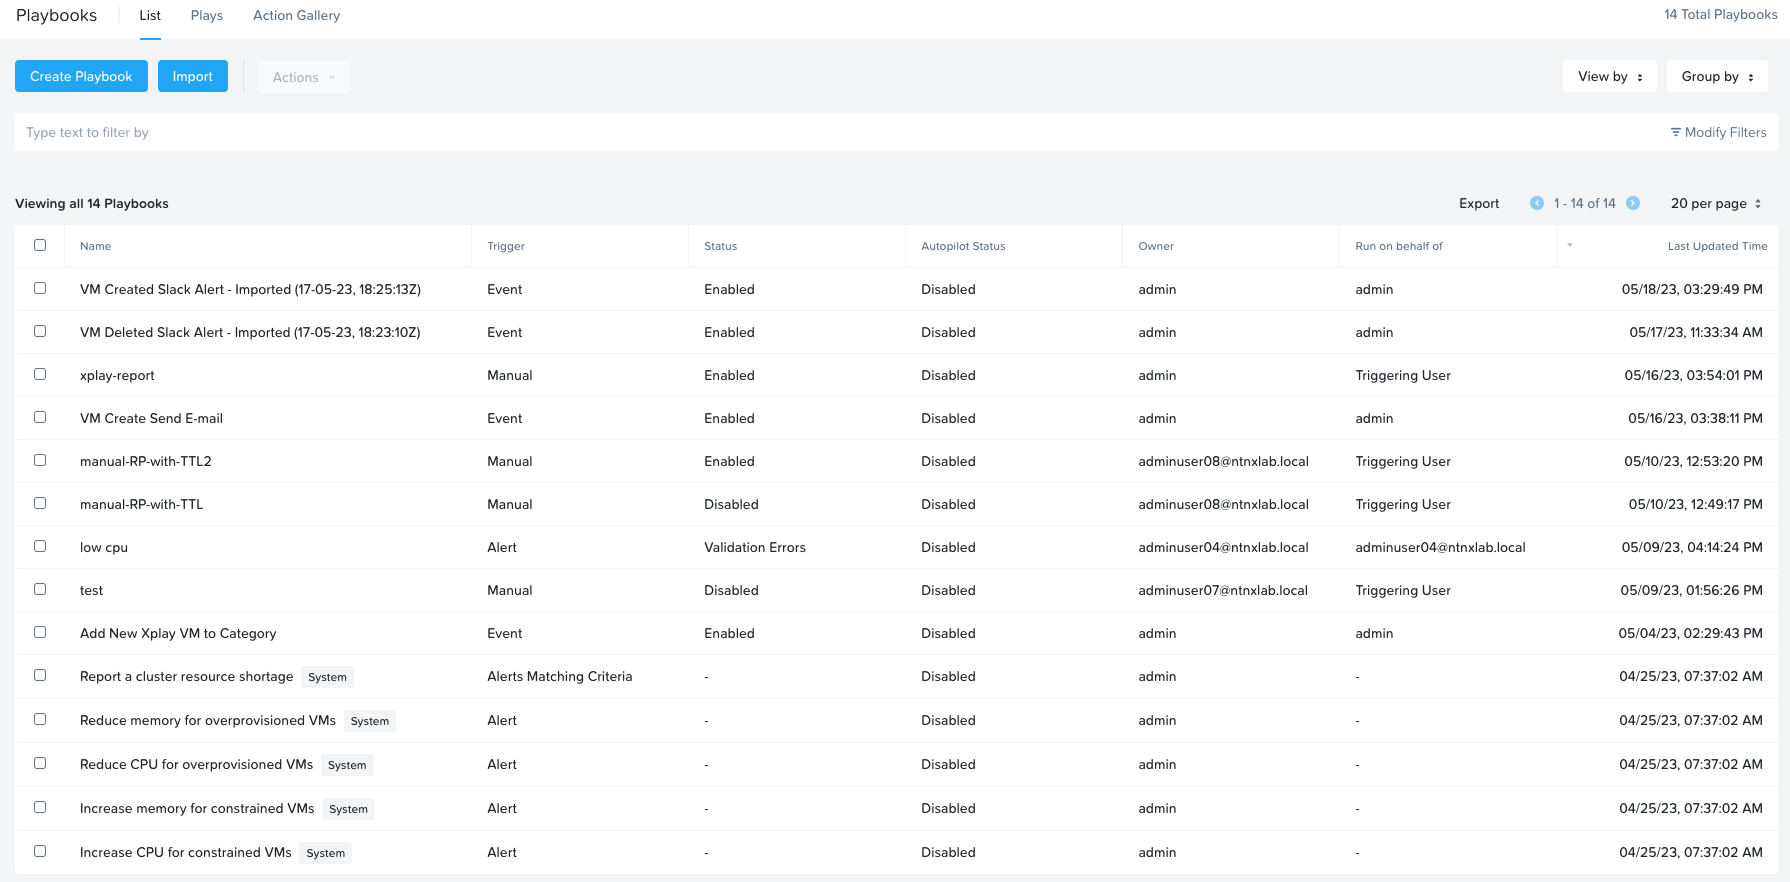 X-Play - Playbooks
From here you can create a new playbook by first defining the trigger:
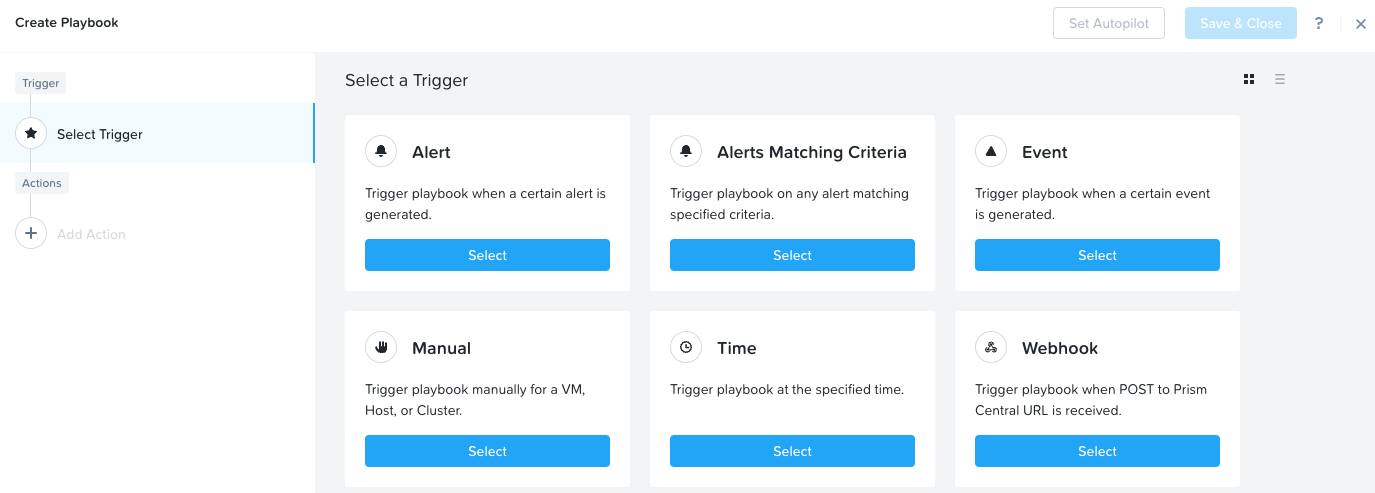 X-Play - Trigger
The following shows an example trigger which is based upon a user-defined alert policy:
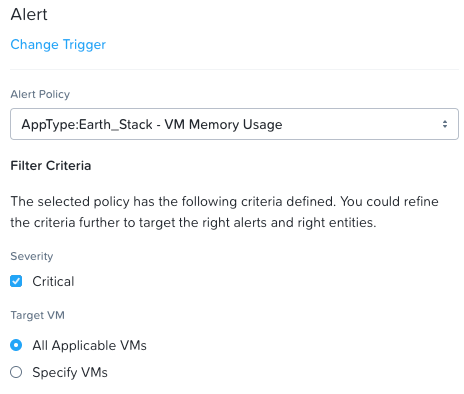 X-Play - Trigger - User Defined Alert
Once the trigger has been defined, you now specify a series of actions. The following shows some sample actions:
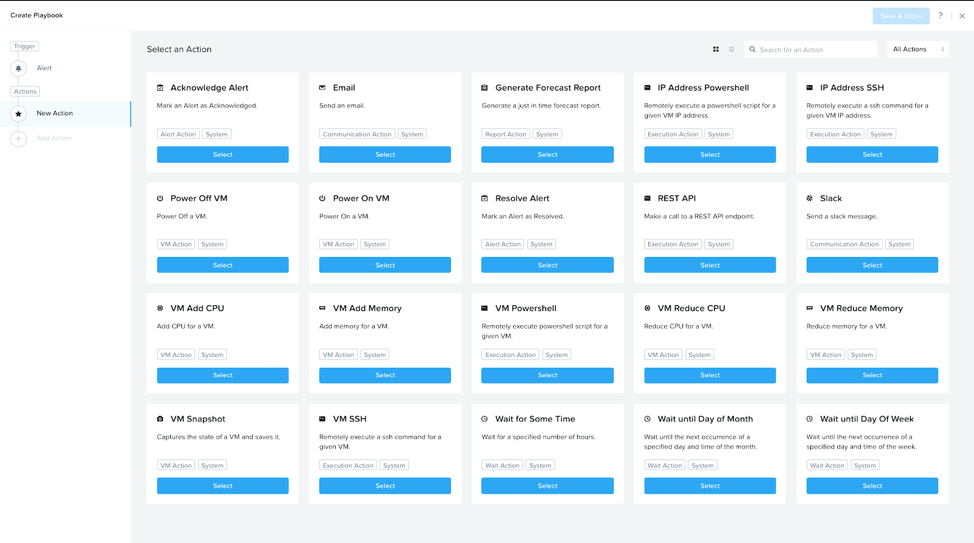 X-Play - Actions
You then input the details for the action, this shows a sample REST API call:
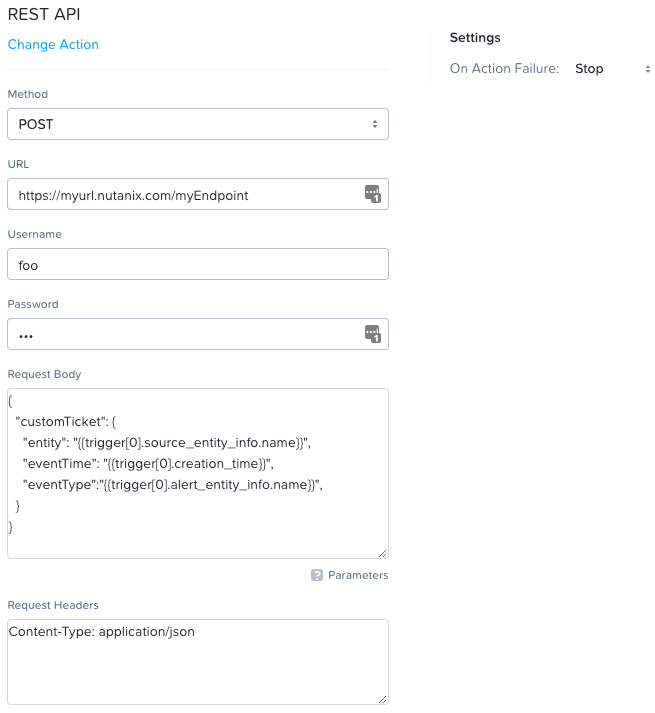 X-Play - Sample REST Action
X-Play provides a multitude of default actions like sending email, sending a slack message, as well as others like performing a REST API call.
This is critical when we think about interfacing with external systems like a CMDB or other ticketing / automation tools. By using a REST API action we can interface with those to create / resolve tickets, kick off other workflows, etc. This is an extremely powerful option as it enables all systems to be in sync.
For entity / event specific details you can use the ‘parameters’ variables which will give you details about the event, entity and others:
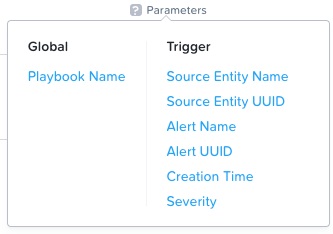 X-Play - Action Parameters
Once complete you can save you play and it will start to execute as defined.
The following shows a sample play whith multiple actions performed:
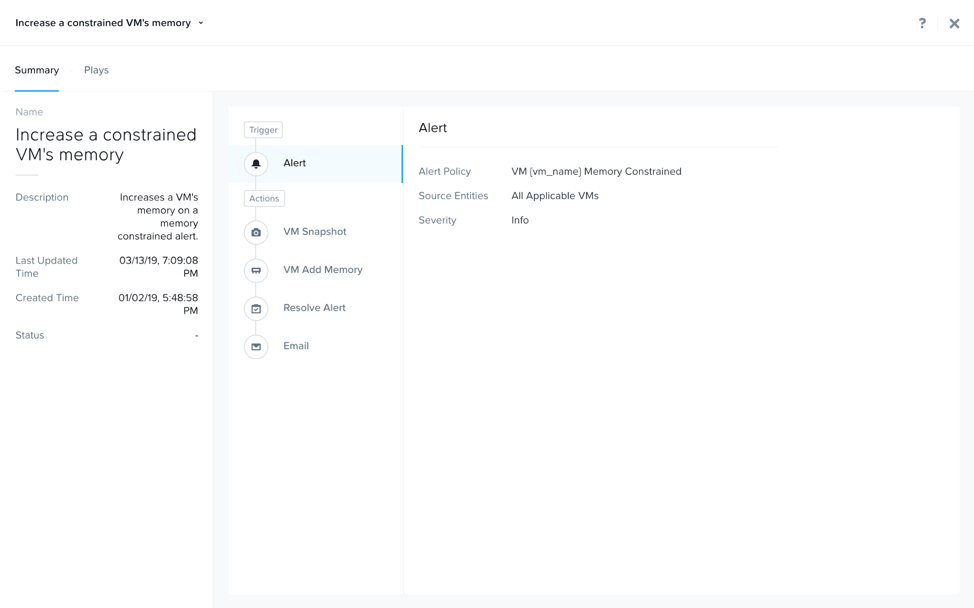 X-Play - Sample Playbook
The plays tab will show execution time of the play and status:
 X-Play - Plays Executed
For some example playbooks that you can import into your own instance, check out the Playbooks Library on nutanix.dev!
Also, check out Getting Started with Nutanix X-Play for more examples and references.
©2025 Nutanix, Inc. All rights reserved. Nutanix, the Nutanix logo and all Nutanix product and service names mentioned are registered trademarks or trademarks of Nutanix, Inc. in the United States and other countries. All other brand names mentioned are for identification purposes only and may be the trademarks of their respective holder(s).