» Download this section as PDF (opens in a new tab/window)
Prism is fairly straight forward and simple to use, however we’ll cover some of the main pages and basic usage.
Prism Central (if deployed) can be accessed using the IP address specified during configuration or corresponding DNS entry. Prism Element can be accessed via Prism Central (by clicking on a specific cluster) or by navigating to any Nutanix CVM or cluster IP (preferred).
Once the page has been loaded you will be greeted with the Login page where you will use your Prism or Active Directory credentials to login.
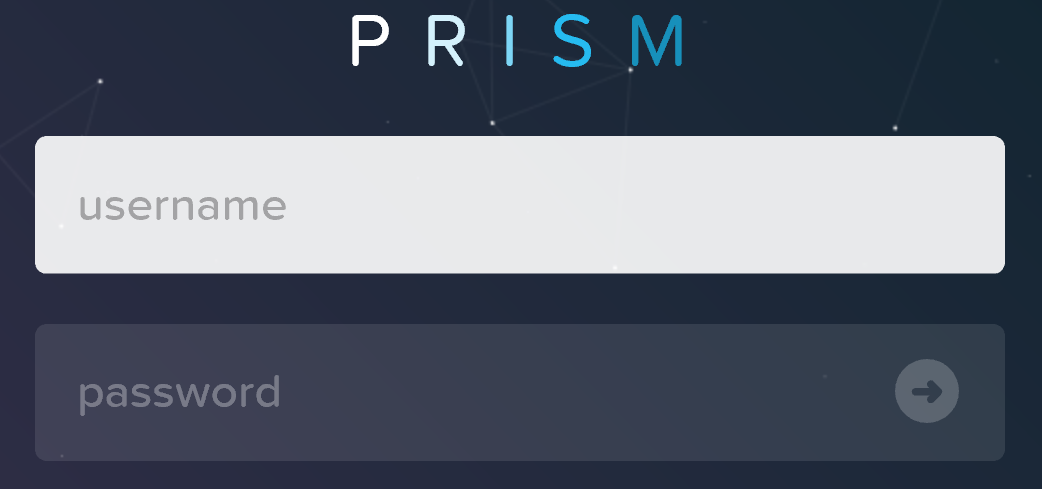 Prism Login Page
Upon successful login you will be sent to the dashboard page which will provide overview information for managed cluster(s) in Prism Central or the local cluster in Prism Element.
Prism Central and Prism Element will be covered in more detail in the following sections.
The figure shows a sample Prism Central dashboard where multiple clusters can be monitored / managed:
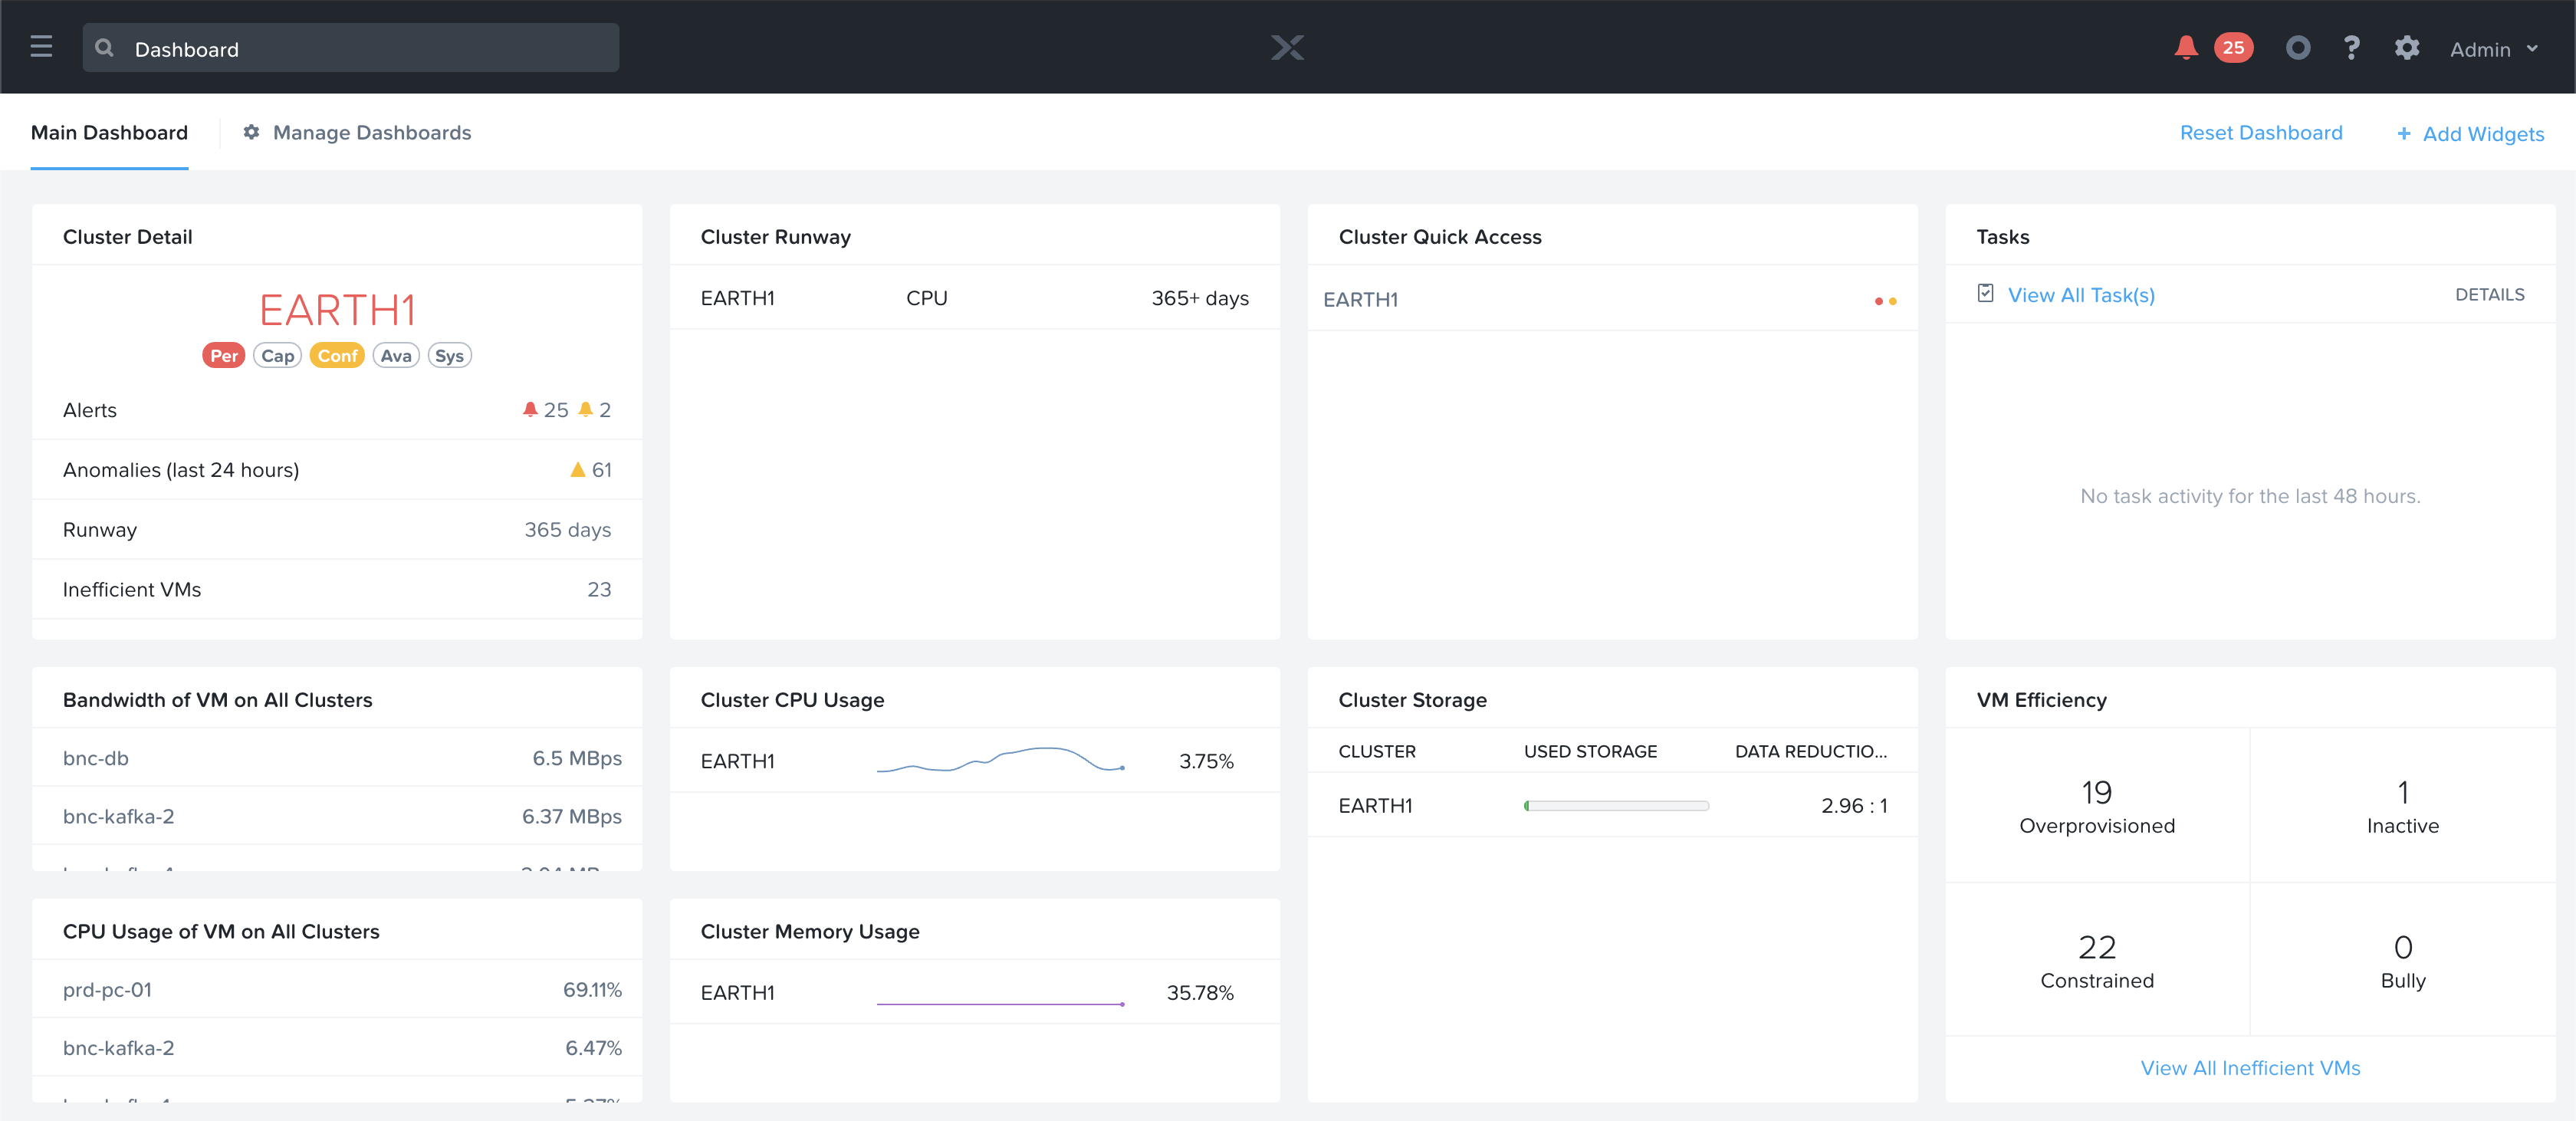 Prism Central - Dashboard
From here you can monitor the overall status of your environment, and dive deeper if there are any alerts or items of interest.
Prism Central contains the following main pages (NOTE: Search is the preferred / recommended method to navigation):
To access the menu click on the hamburger icon::
 Prism Central - Hamburger
The menu expands to display the available options:
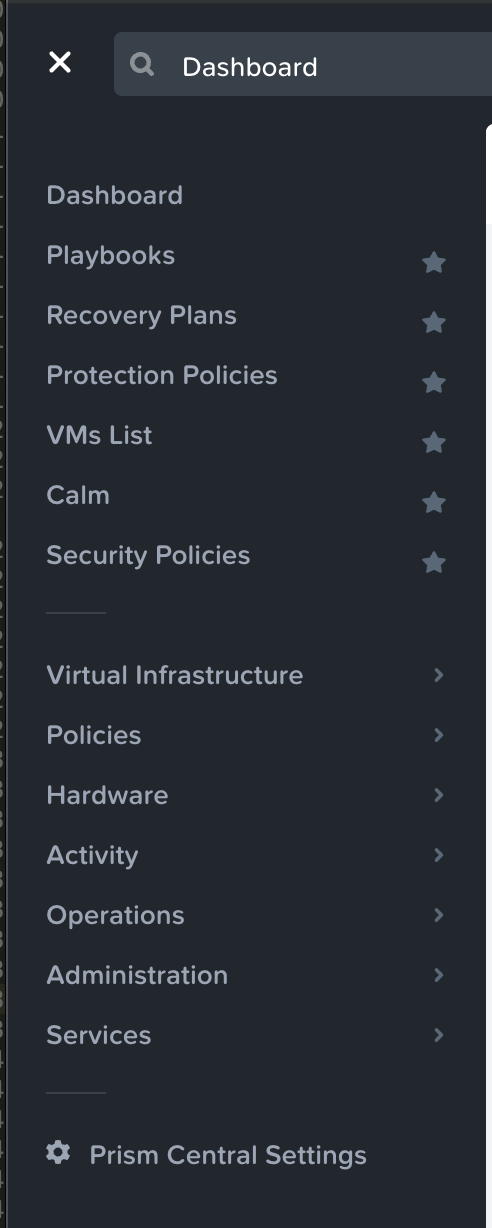 Prism Central - Menu Bar
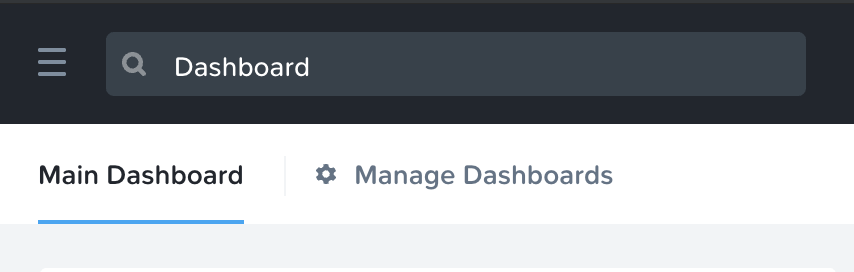
Search is now the primary mechanism for Navigating the Prism Central UI (menus are still available).
To use the search bar to navigate you can use the search bar in the top left corner next to the menu icon.
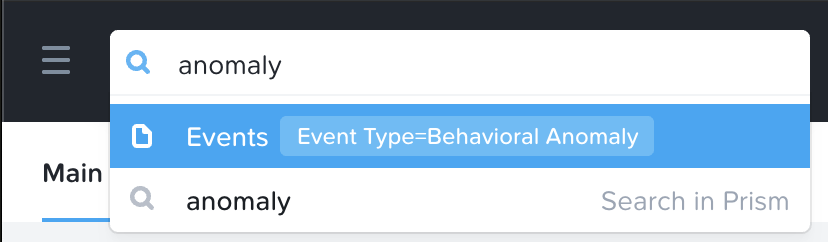 Prism Central - Search
PC Search allows for a great deal of semantics to be leveraged, some examples include:
| Rule | Example |
|---|---|
| Entity type | vms |
| Entity type + metric perspective (io, cpu, memory) | vms io |
| Entity type + alerts | vm alerts |
| Entity type + alerts + alert filters | vm alerts severity=critical |
| Entity type + events | vm events |
| Entity type + events + event filters | vm events classification=anomaly |
| Entity type + filters (both metric and attribute) | vm “power state”=on |
| Entity type + filters + metric perspective (io, cpu, memory) | vm “power state”=on io |
| Entity type + filters + alerts | vm “power state”=on alerts |
| Entity type + filters + alerts + (alert filters) | vm “power state”=on alerts severity=critical |
| Entity type + filters + events | vm “power state”=on events |
| Entity type + filters + events + event filters | vm “power state”=on events classification=anomaly |
| Entity instance (name, ip address, disk serial etc) | vm1, 10.1.3.4, BHTXSPWRM |
| Entity instance + Metric perspective (io, cpu, memory) | vm1 io |
| Entity instance + alerts | vm1 alerts |
| Entity instance + alerts + alert filters | vm1 alerts severity=critical |
| Entity instance + events | vm1 events |
| Entity instance + events + event filters | vm1 events classification=anomaly |
| Entity instance + pages | vm1 nics, c1 capacity |
| Parent instance + entity type | c1 vms |
| Alert title search | Disk bad alerts |
| Page name search | Analysis, tasks |
The prior is just a small subset of the semantics, the best way to get familiar with them is to give it a shot!
Prism Element contains the following main pages:
The home page will provide detailed information on alerts, service status, capacity, performance, tasks, and much more. To get further information on any of them you can click on the item of interest.
The figure shows a sample Prism Element dashboard where local cluster details are displayed:
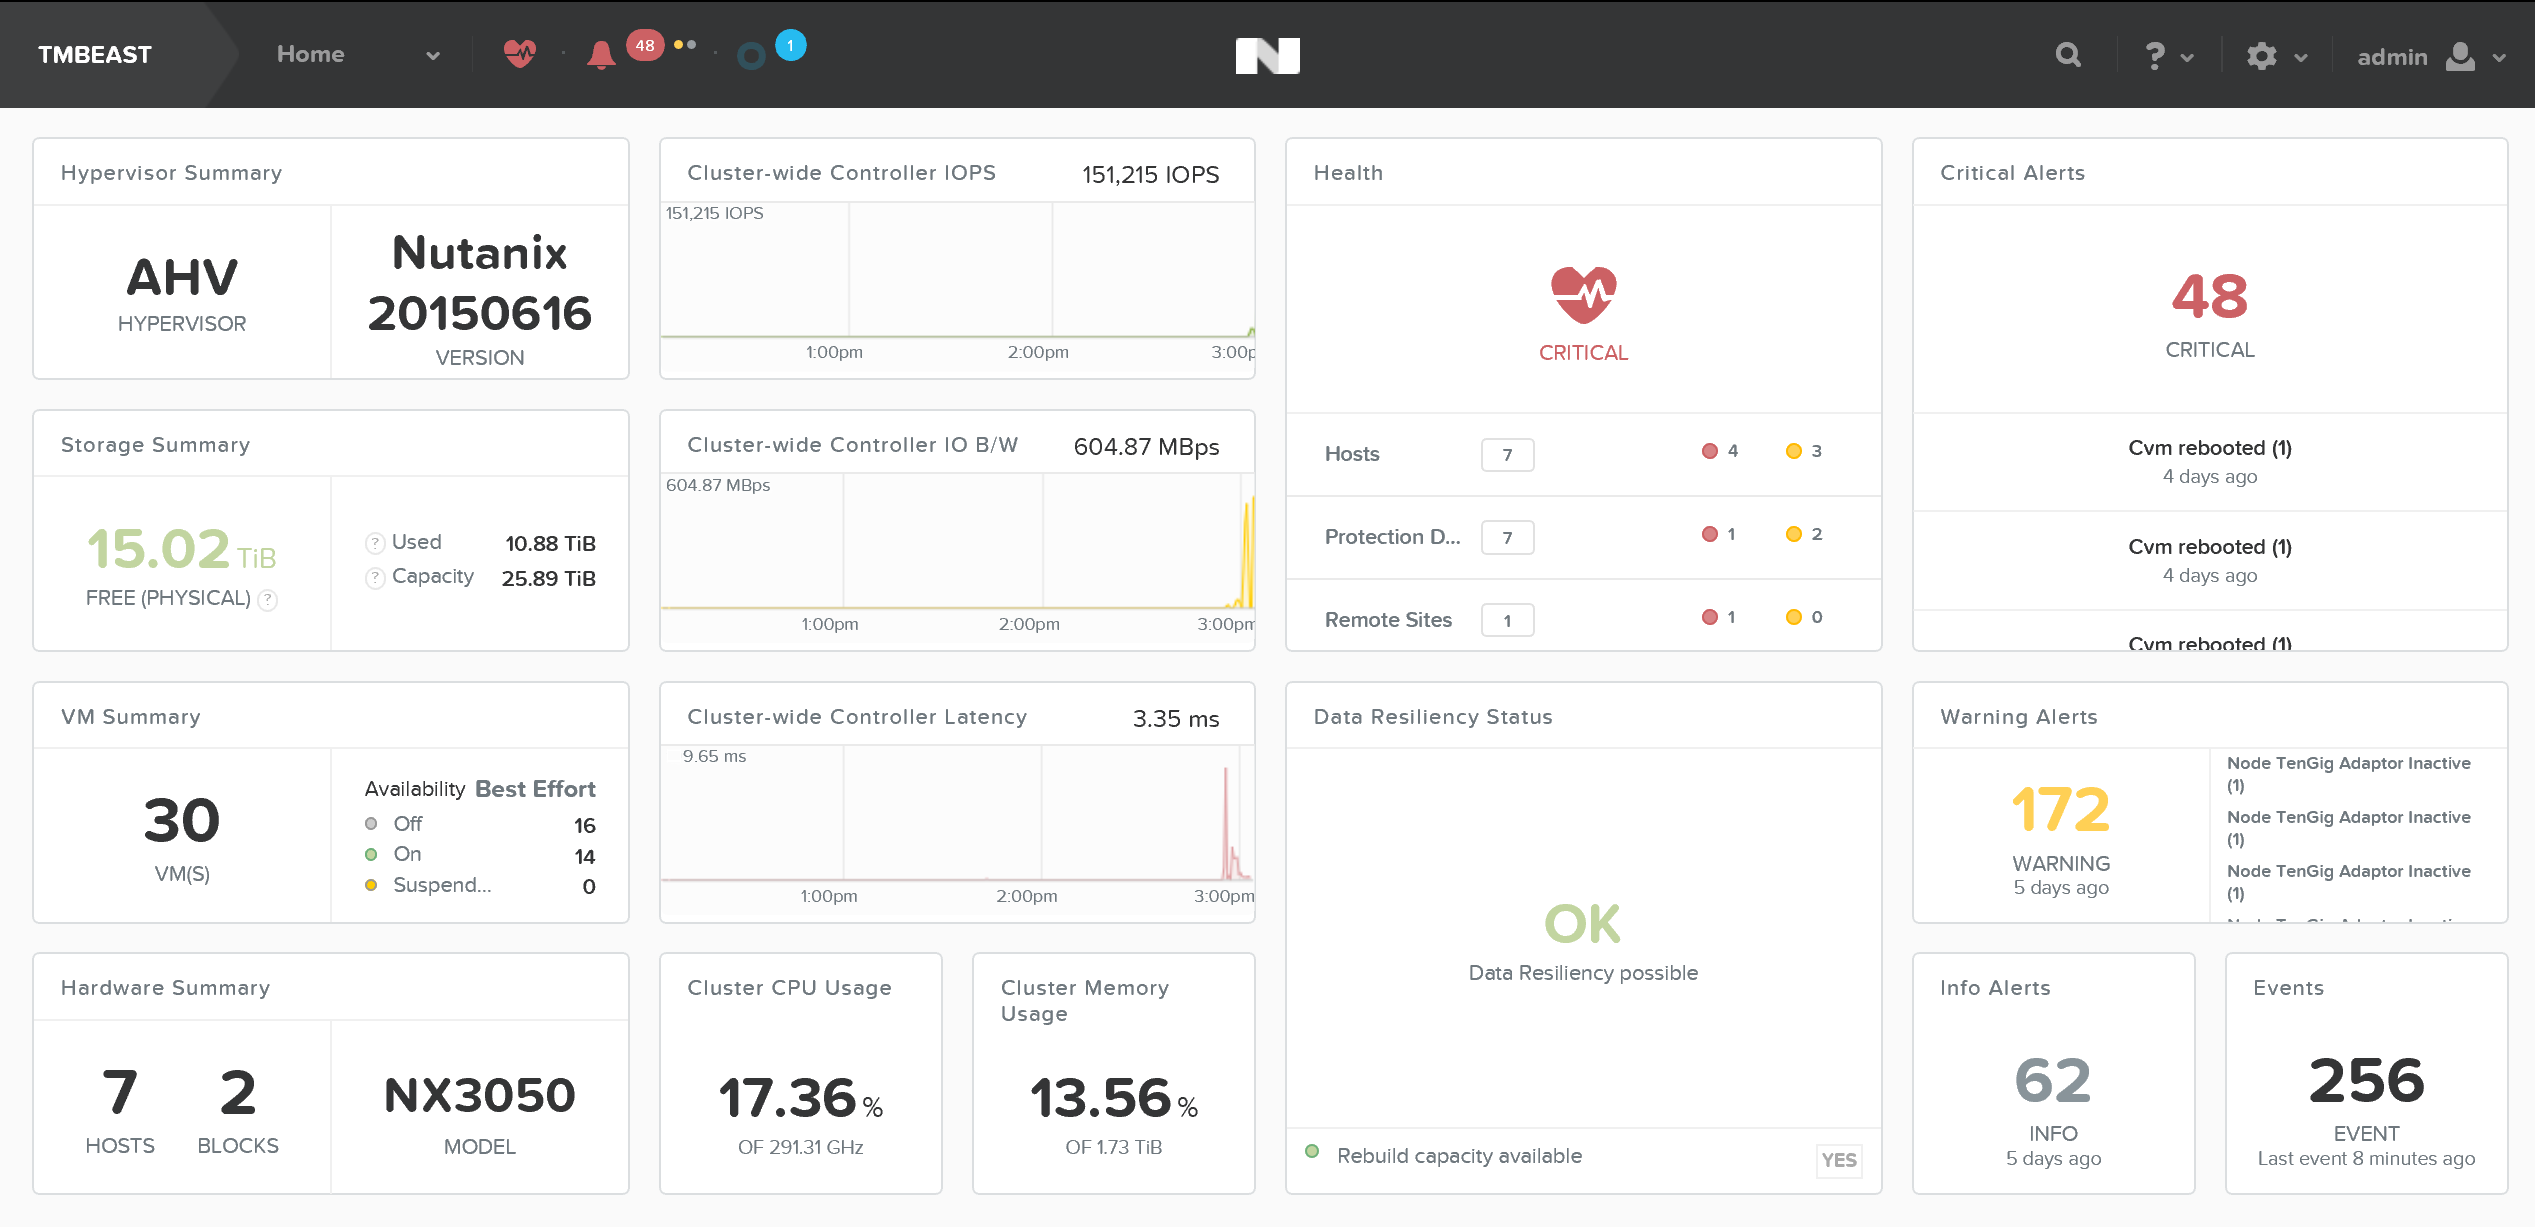 Prism Element - Dashboard
Accessibility and ease of use is a critical construct in Prism. To simplify things for the end-user a set of shortcuts have been added to allow users to do everything from their keyboard.
The following characterizes some of the key shortcuts:
Change view (page context aware):
Activities and Events:
Drop down and Menus (Navigate selection using arrow keys):
©2025 Nutanix, Inc. All rights reserved. Nutanix, the Nutanix logo and all Nutanix product and service names mentioned are registered trademarks or trademarks of Nutanix, Inc. in the United States and other countries. All other brand names mentioned are for identification purposes only and may be the trademarks of their respective holder(s).