» Download this section as PDF (opens in a new tab/window)
These are advanced Nutanix pages besides the standard user interface that allow you to monitor detailed stats and metrics. The URLs are formatted in the following way: http://<Nutanix CVM IP/DNS>:<Port/path (mentioned below)> Example: http://MyCVM-A:2009 NOTE: if you’re on a different subnet IPtables will need to be disabled on the CVM to access the pages.
This is a Stargate page used to monitor the back end storage system and should only be used by advanced users. I’ll have a post that explains the 2009 pages and things to look for.
This is a Stargate page used to monitor the back end latency.
This is a Stargate page used to show various vDisk stats including histograms of I/O sizes, latency, write hits (e.g., OpLog, eStore), read hits (cache, SSD, HDD, etc.) and more.
This is the Stargate page used to monitor activity traces for operations.
This is the Stargate page used to monitor various counters.
This is the Curator page which is used for monitoring Curator runs.
This is the Curator control page which is used to manually start Curator jobs
This is the Chronos page which monitors jobs and tasks scheduled by Curator.
This is the Cerebro page which monitors the protection domains, replication status and DR.
This is the Cerebro page used to monitor activity traces for PD operations and replication.
This is the main Acropolis page and shows details about the environment hosts, any currently running tasks and networking details.
This is an Acropolis page used to show information about VM and resource scheduling used for placement decisions. This page shows the available host resources and VMs running on each host.
This is an Acropolis page used to show information about Acropolis tasks and their state. You can click on the task UUID to get detailed JSON about the task.
This is an Acropolis page used to show information about Acropolis VMs and details about them. You can click on the VM Name to connect to the console.
Description: Check cluster status from the CLI
cluster status
Description: Check a single CVM’s service status from the CLI
genesis status
Check upgrade status
upgrade_status
Perform manual / cli upgrade
download NUTANIXINSTALLERPACKAGE.tar.gz into ~/tmp
tar xzf NUTANIXINSTALLERPACKAGE.tar.gz
cd ~/tmp
./install/bin/cluster -i ./install upgrade
Description: Check hypervisor upgrade status from the CLI on any CVM
host_upgrade_status
Detailed logs (on every CVM)
~/data/logs/host_upgrade.out
Description: Restart a single cluster service from the CLI
Stop service
cluster stop ServiceName
Start stopped services
cluster start #NOTE: This will start all stopped services
Description: Start stopped cluster services from the CLI
Start stopped services
cluster start #NOTE: This will start all stopped services
OR
Start single service
Start single service: cluster start ServiceName
Description: Restart a single cluster service from the CLI
Stop Service
genesis stop ServiceName
Start Service
cluster start
Description: Start stopped cluster services from the CLI
cluster start #NOTE: This will start all stopped services
Description: Perform cluster add-node from CLI
ncli cluster discover-nodes | egrep “Uuid” | awk ‘{print $4}’ | xargs -I UUID ncli cluster add-node node-uuid=UUID </pre>
Description: Find the cluster ID for the current cluster
zeus_config_printer | grep cluster_id
Description: Enable port through IPtables
sudo vi /etc/sysconfig/iptables -A INPUT -m state --state NEW -m tcp -p tcp --dport PORT -j ACCEPT
sudo service iptables restart
Description: Displays the shadow clones in the following format: name#id@svm_id
vdisk_config_printer | grep '#'
Description: Reset the Latency Page (CVM IP):2009/latency) counters
allssh "wget 127.0.0.1:2009/latency/reset"
Description: Find vDisk information and details including name, id, size, iqn and others
vdisk_config_printer
Description: Find the current number of vDisks (files) on DSF
vdisk_config_printer | grep vdisk_id | wc -l
Description: Displays a provided vDisks egroup IDs, size, transformation and savings, garbage and replica placement
vdisk_usage_printer -vdisk_id=VDISK_ID
Description: Starts a Curator scan from the CLI
allssh "wget -O - "http://localhost:2010/master/api/client/StartCuratorTasks?task_type=2";"
allssh "wget -O - "http://localhost:2010/master/api/client/StartCuratorTasks?task_type=3";"
allssh "wget -O - "http://localhost:2010/master/api/client/RefreshStats";"
Description: Check for under replicated data using curator_cli
curator_cli get_under_replication_info summary=true
Description: Compact the metadata ring
allssh "nodetool -h localhost compact"
Description: Find the NOS version (NOTE: can also be done using NCLI)
allssh "cat /etc/nutanix/release_version"
Description: Find the CVM image version
allssh "cat /etc/nutanix/svm-version"
Description: Create fingerprints for a particular vDisk (For dedupe) NOTE: dedupe must be enabled on the container
vdisk_manipulator –vdisk_id=vDiskID --operation=add_fingerprints
Description: Create fingerprints for all vDisk(s) (For dedupe) NOTE: dedupe must be enabled on the container
for vdisk in `vdisk_config_printer | grep vdisk_id | awk {'print $2'}`; do vdisk_manipulator -vdisk_id=$vdisk --operation=add_fingerprints; done
Description: Echos the factory_config.jscon for all nodes in the cluster
allssh "cat /etc/nutanix/factory_config.json"
Description: Upgrade a single node’s NOS version to match that of the cluster
~/cluster/bin/cluster -u NEW_NODE_IP upgrade_node
Description: List files and associated information for vDisks stored on DSF
Nfs_ls
Get help text
Nfs_ls --help
Description: Installs the Nutanix Cluster Check (NCC) health script to test for potential issues and cluster health
Download NCC from the Nutanix Support Portal (portal.nutanix.com)
SCP .tar.gz to the /home/nutanix directory
Untar NCC .tar.gz
tar xzmf ncc.tar.gz --recursive-unlink
Run install script
./ncc/bin/install.sh -f ncc.tar.gz
Create links
source ~/ncc/ncc_completion.bash
echo "source ~/ncc/ncc_completion.bash" >> ~/.bashrc
Description: Runs the Nutanix Cluster Check (NCC) health script to test for potential issues and cluster health. This is a great first step when troubleshooting any cluster issues.
Make sure NCC is installed (steps above)
Run NCC health checks
ncc health_checks run_all
progress_monitor_cli -fetchall
progress_monitor_cli --entity_id=ENTITY_ID --operation=OPERATION --entity_type=ENTITY_TYPE --delete
# NOTE: operation and entity_type should be all lowercase with k removed from the begining
The following section will cover specific metrics and thresholds on the Nutanix back end. More updates to these coming shortly!
More coming soon!
Description: Find Acropolis logs for the cluster
allssh "cat ~/data/logs/Acropolis.log"
Description: Find ERROR logs for the cluster
allssh "cat ~/data/logs/COMPONENTNAME.ERROR"
Example for Stargate
allssh "cat ~/data/logs/Stargate.ERROR"
Description: Find FATAL logs for the cluster
allssh "cat ~/data/logs/COMPONENTNAME.FATAL"
Example for Stargate
allssh "cat ~/data/logs/Stargate.FATAL"
In most cases Prism should be able to give you all of the information and data points you require. However, in certain scenarios, or if you want some more detailed data you can leverage the Stargate aka 2009 page. The 2009 page can be viewed by navigating to CVMIP:2009.
If you're on a different network segment (L2 subnet) you'll need to add a rule in IP tables to access any of the back-end pages.
At the top of the page is the overview details which show various details about the cluster:
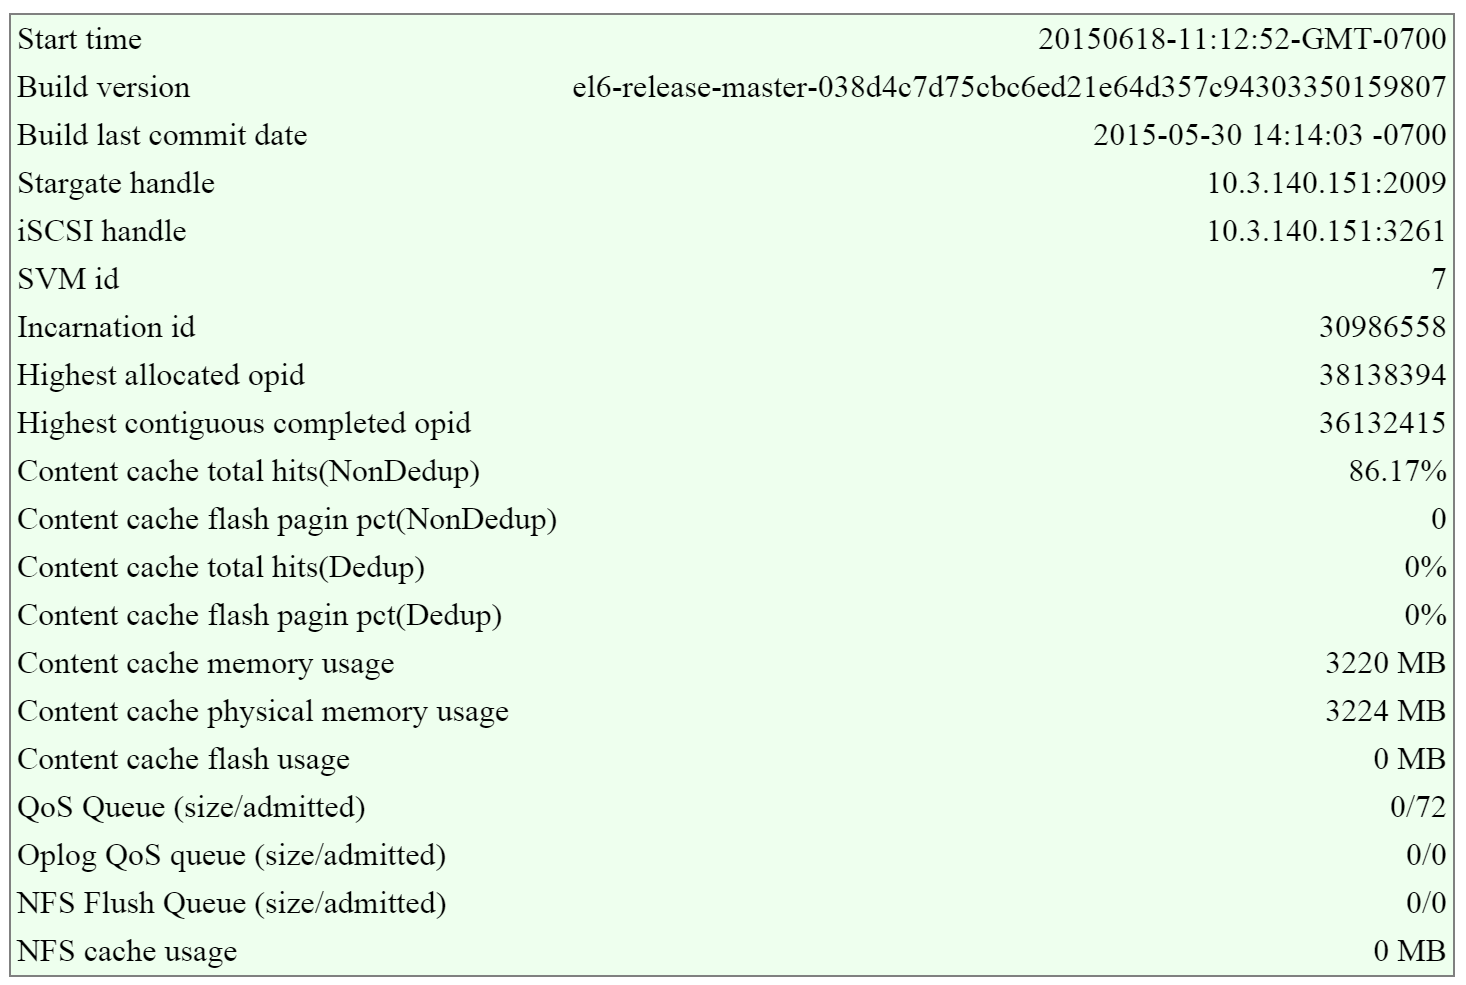 2009 Page - Stargate Overview
In this section there are two key areas to look out for, the first being the I/O queues that shows the number of admitted / outstanding operations.
The figure shows the queues portion of the overview section:
 2009 Page - Stargate Overview - Queues
The second portion is the unified cache details that shows information on cache sizes and hit rates.
The figure shows the unified cache portion of the overview section:
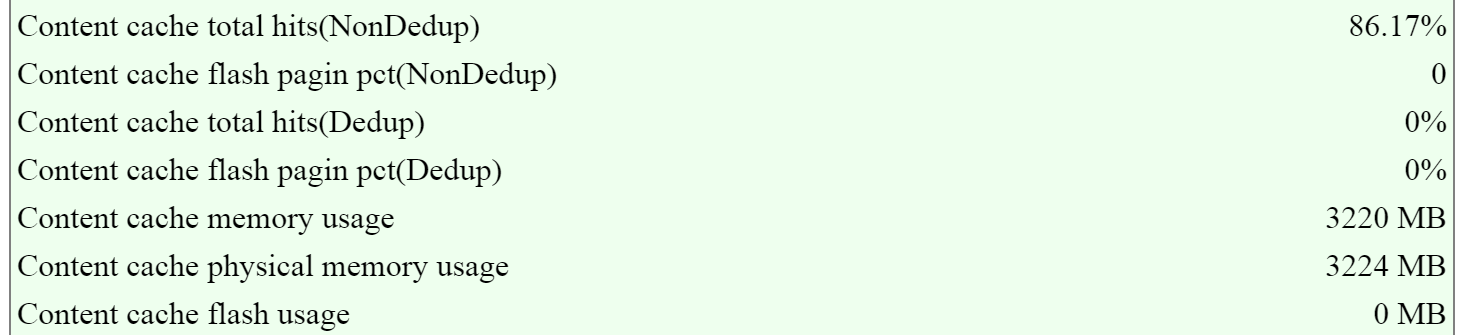 2009 Page - Stargate Overview - Unified Cache
In ideal cases the hit rates should be above 80-90%+ if the workload is read heavy for the best possible read performance.
NOTE: these values are per Stargate / CVM
The next section is the ‘Cluster State’ that shows details on the various Stargates in the cluster and their disk usages.
The figure shows the Stargates and disk utilization (available/total):
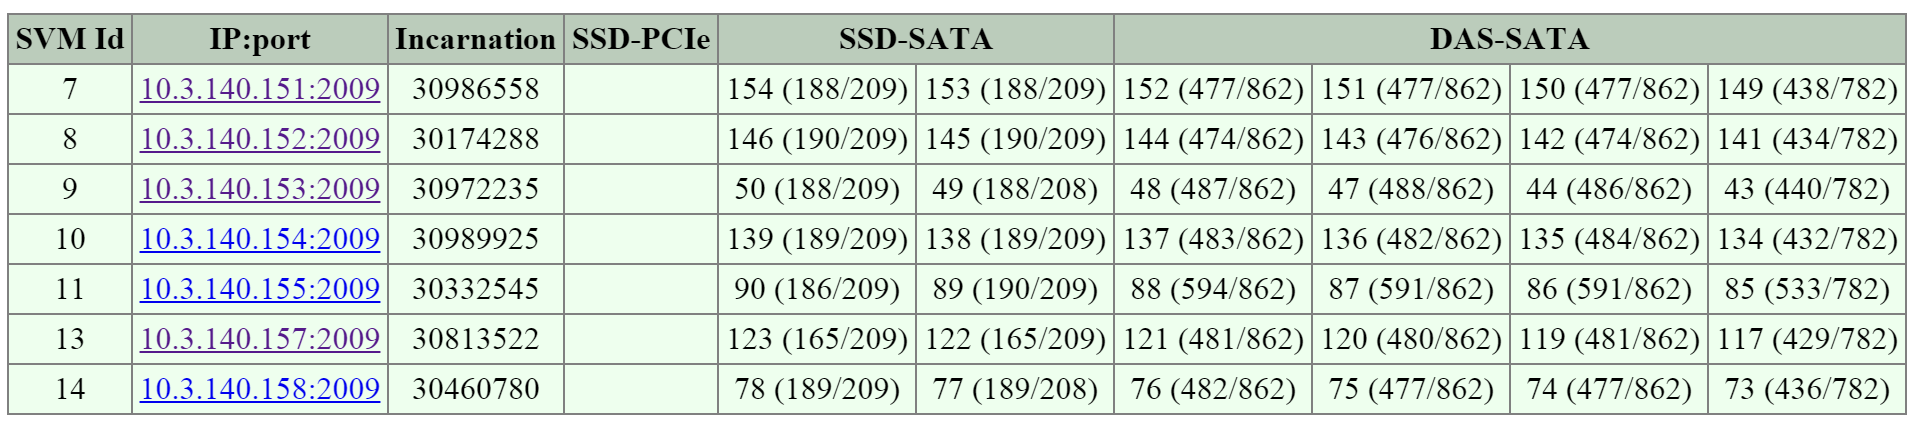 2009 Page - Cluster State - Disk Usage
The next section is the ‘NFS Worker’ section which will show various details and stats per vDisk.
The figure shows the vDisks and various I/O details:
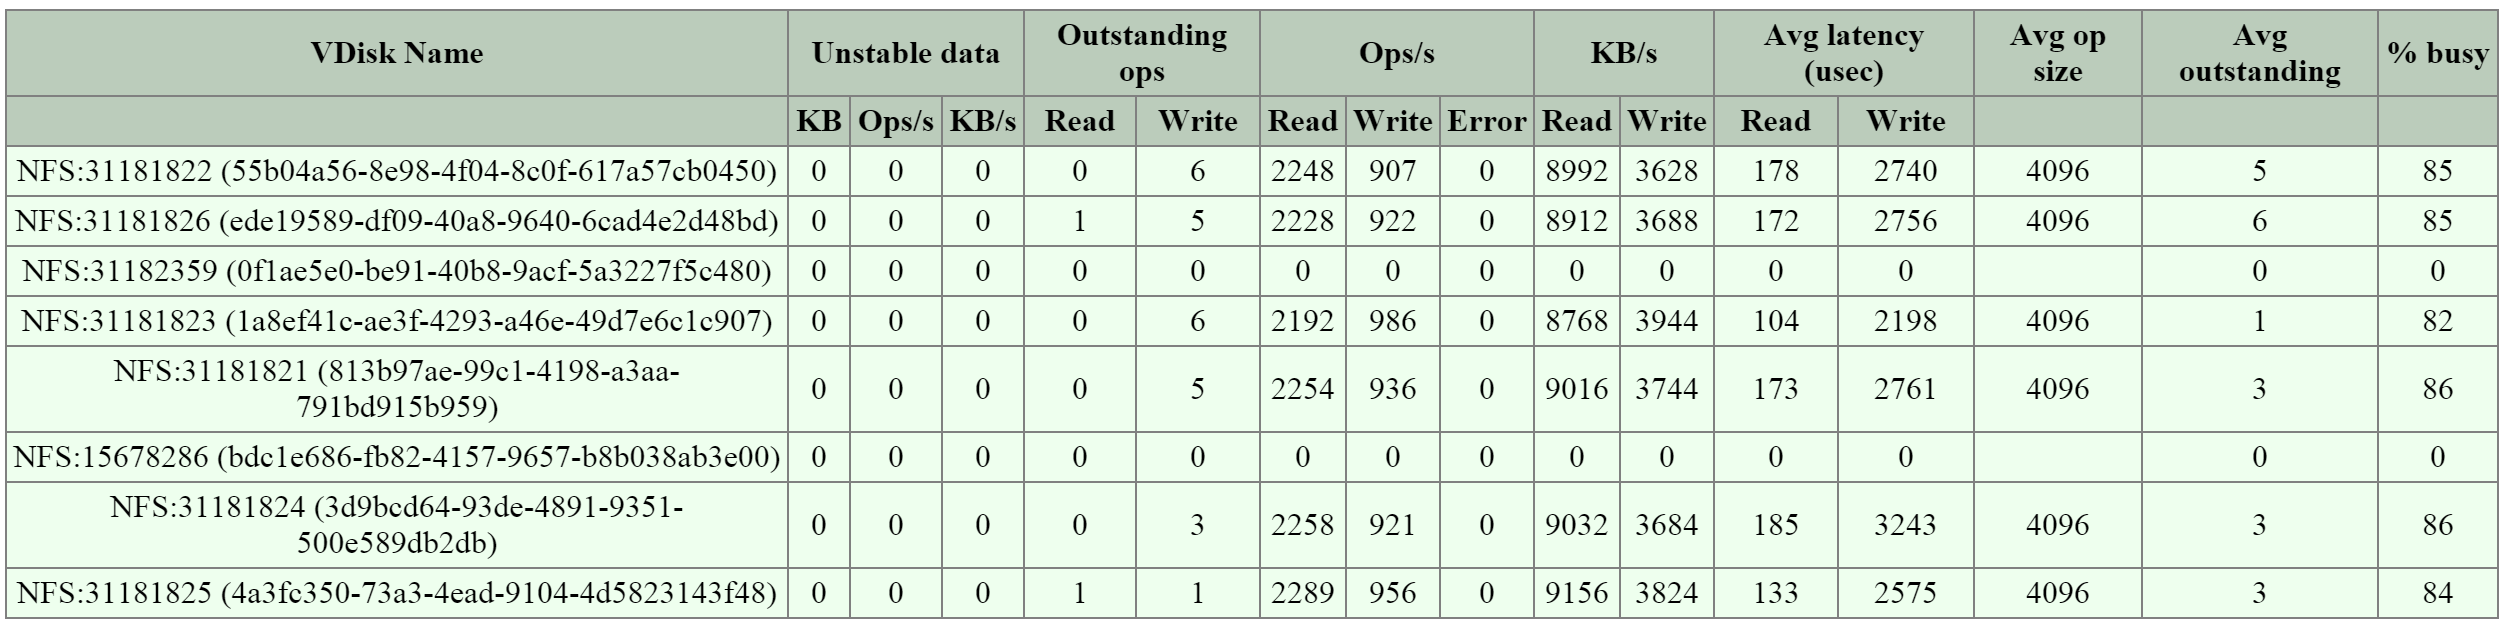 2009 Page - NFS Worker - vDisk Stats
When looking at any potential performance issues the following metrics should be looked at:
For more specific details the vdisk_stats page holds a plethora of information.
The 2009 vdisk_stats page is a detailed page which provides even further data points per vDisk. This page includes details and a histogram of items like randomness, latency histograms, I/O sizes and working set details.
You can navigate to the vdisk_stats page by clicking on the ‘vDisk Id’ in the left hand column.
The figure shows the section and hyperlinked vDisk Id:
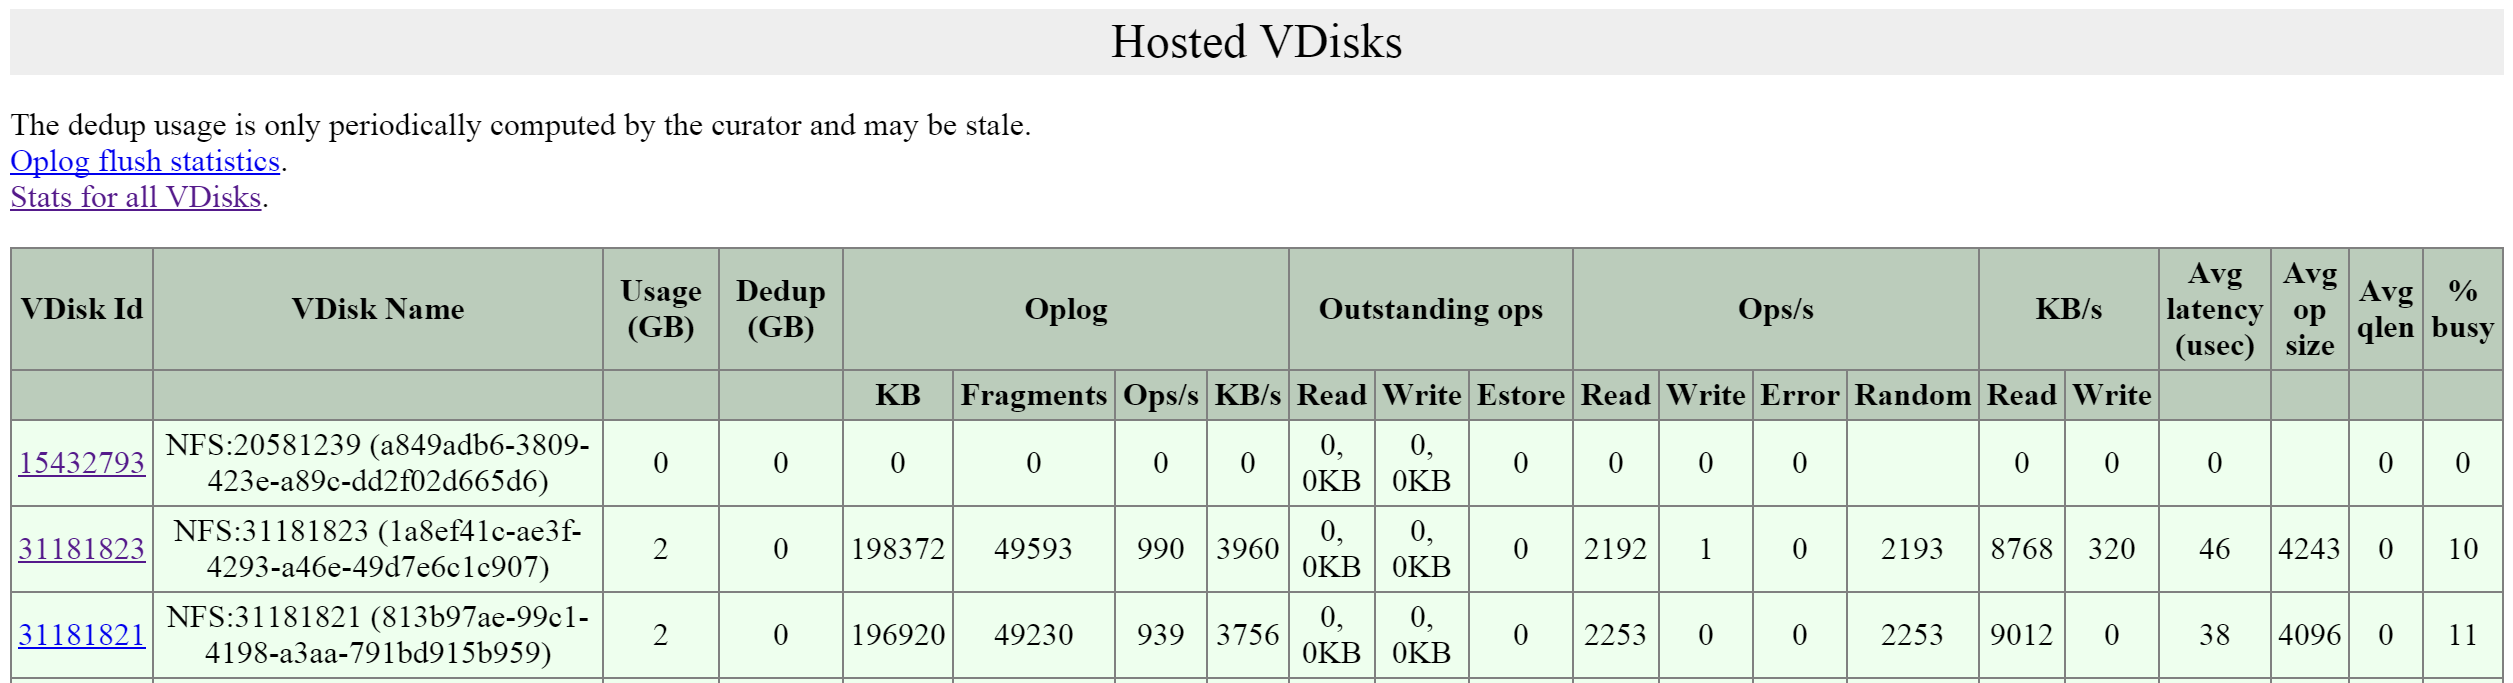 2009 Page - Hosted vDisks
This will bring you to the vdisk_stats page which will give you the detailed vDisk stats. NOTE: These values are real-time and can be updated by refreshing the page.
The first key area is the ‘Ops and Randomness’ section which will show a breakdown of whether the I/O patterns are random or sequential in nature.
The figure shows the ‘Ops and Randomness’ section:
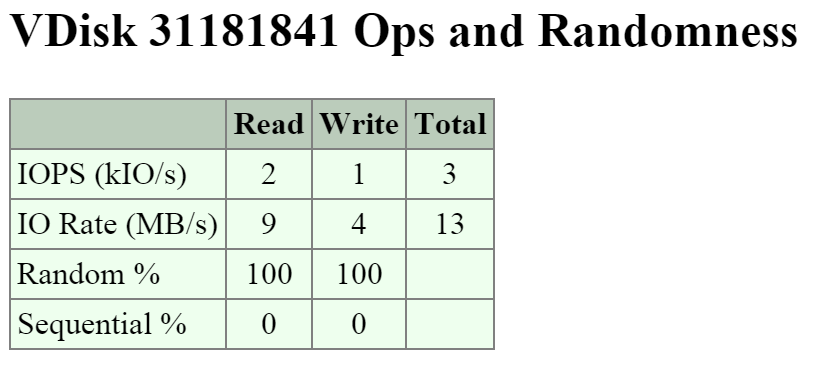 2009 Page - vDisk Stats - Ops and Randomness
The next area shows a histogram of the frontend read and write I/O latency (aka the latency the VM / OS sees).
The figure shows the ‘Frontend Read Latency’ histogram:
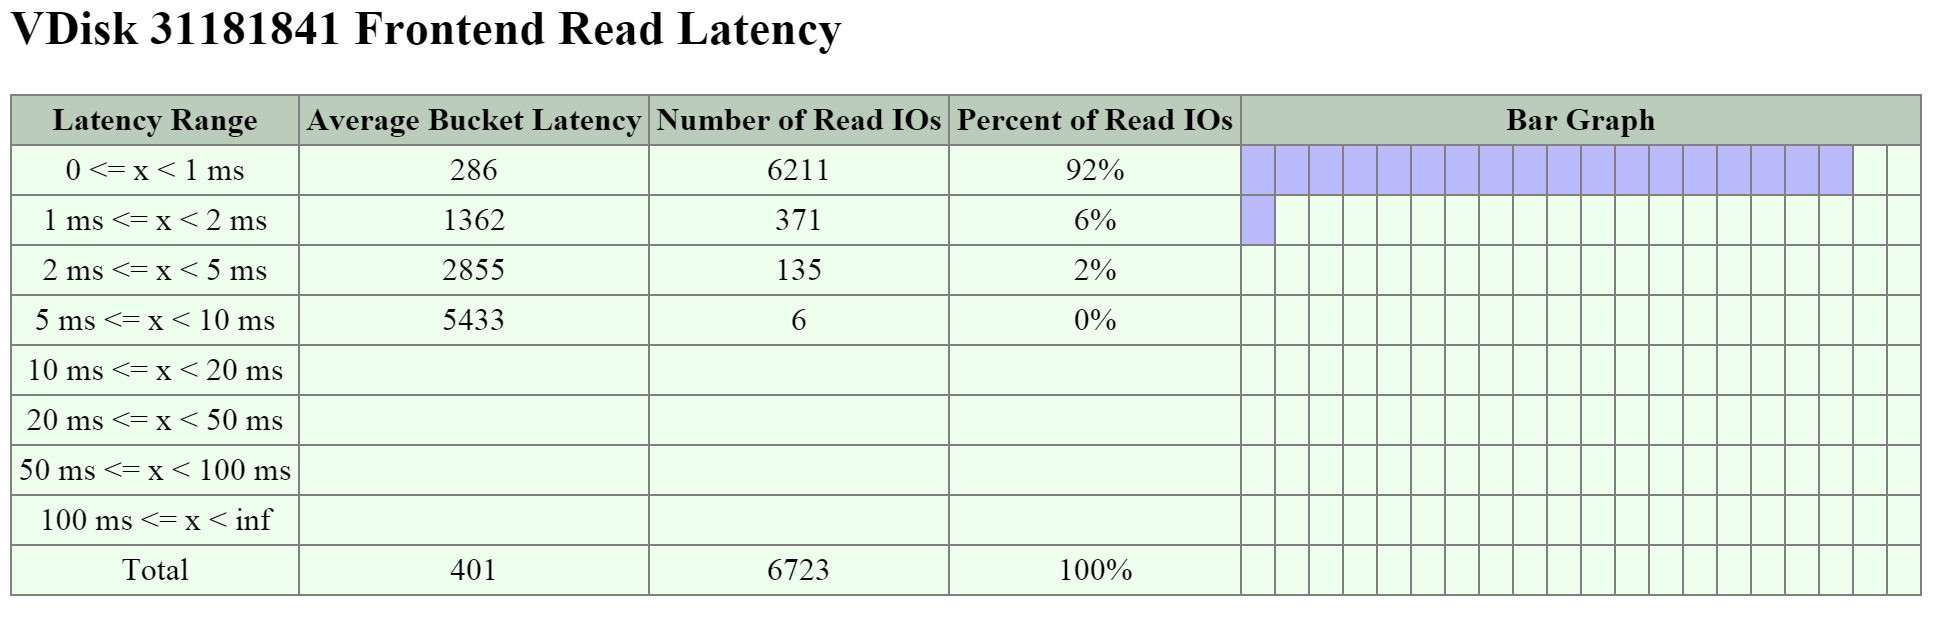 2009 Page - vDisk Stats - Frontend Read Latency
The figure shows the ‘Frontend Write Latency’ histogram:
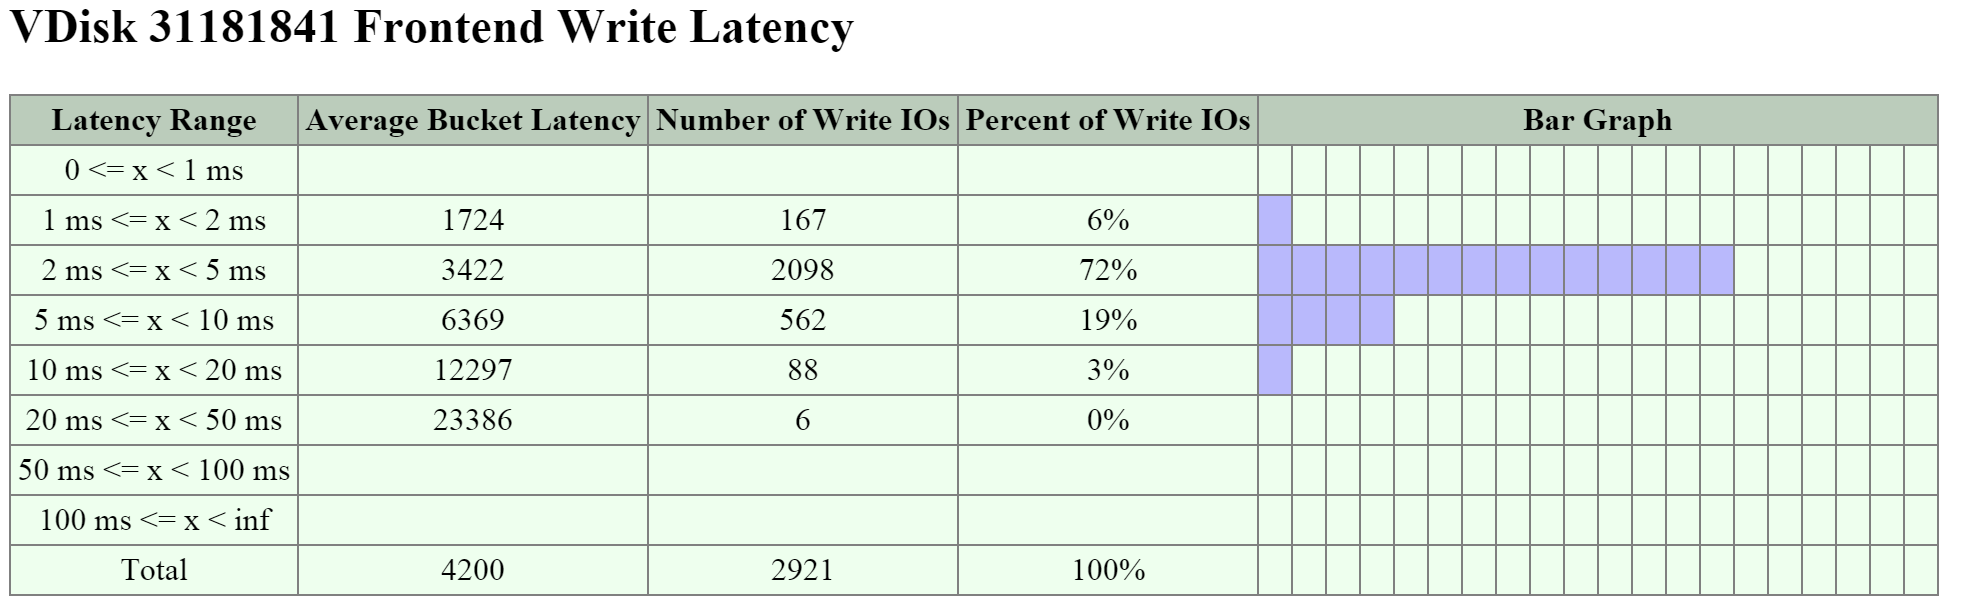 2009 Page - vDisk Stats - Frontend Write Latency
The next key area is the I/O size distribution that shows a histogram of the read and write I/O sizes.
The figure shows the ‘Read Size Distribution’ histogram:
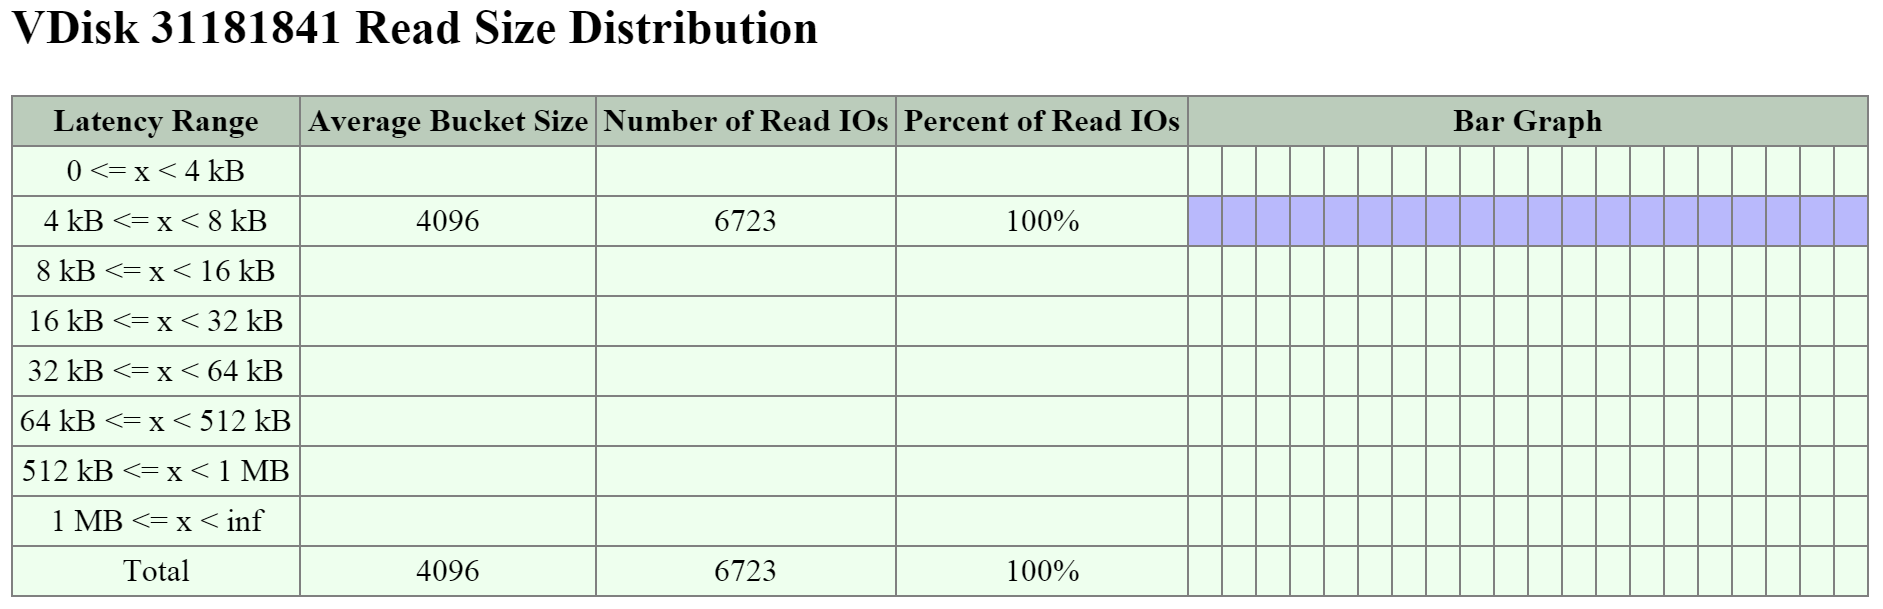 2009 Page - vDisk Stats - Read I/O Size
The figure shows the ‘Write Size Distribution’ histogram:
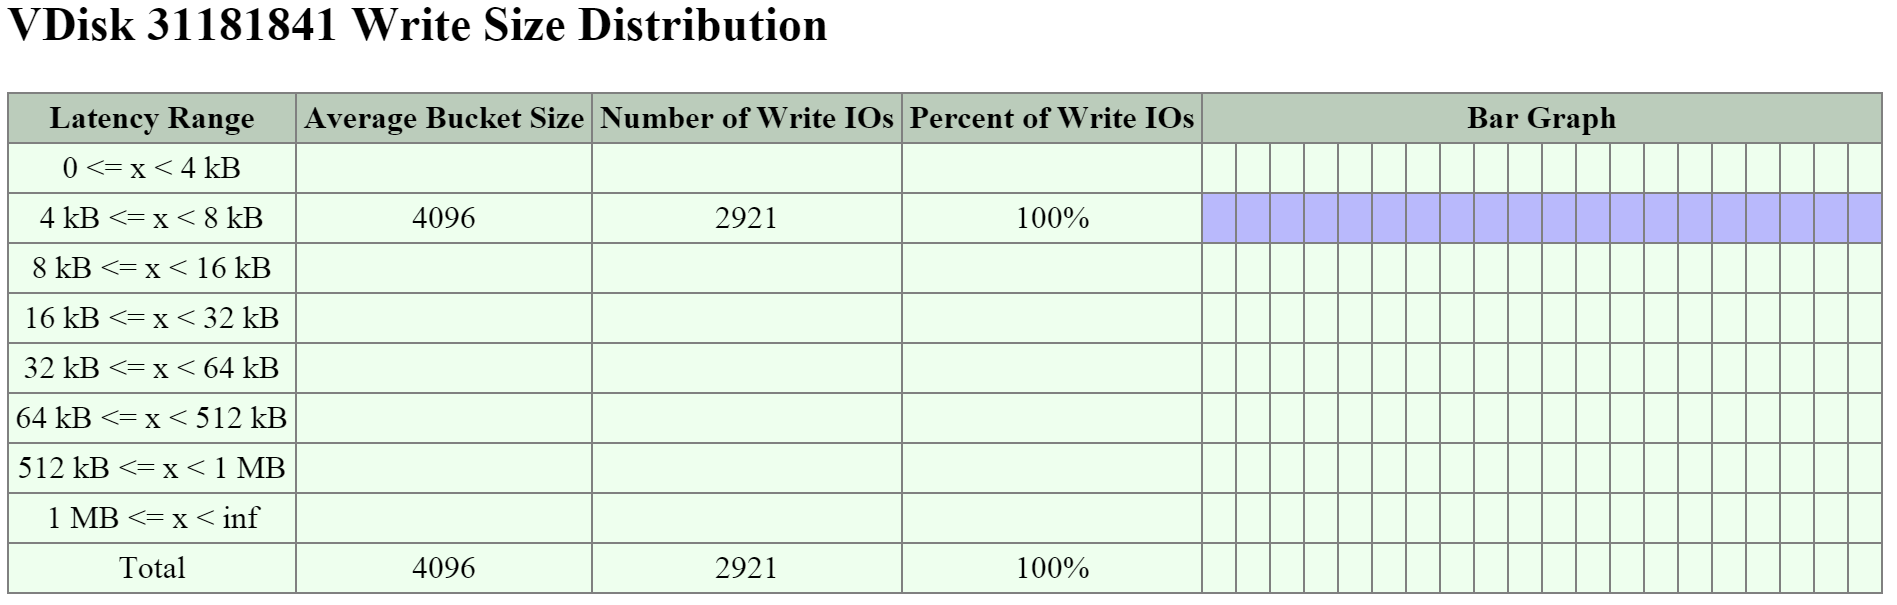 2009 Page - vDisk Stats - Write I/O Size
The next key area is the ‘Working Set Size’ section which provides insight on working set sizes for the last 2 minutes and 1 hour. This is broken down for both read and write I/O.
The figure shows the ‘Working Set Sizes’ table:
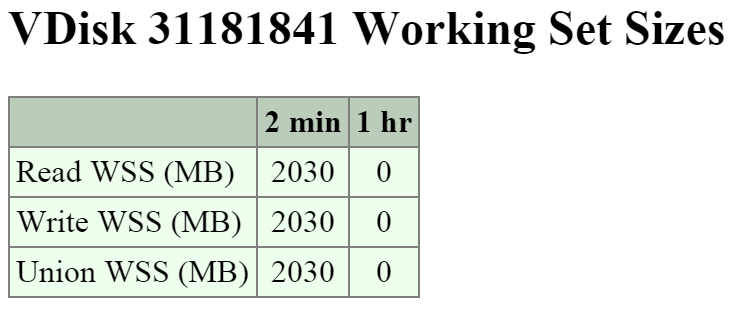 2009 Page - vDisk Stats - Working Set
The ‘Read Source’ provides details on which tier or location the read I/Os are being served from.
The figure shows the ‘Read Source’ details:
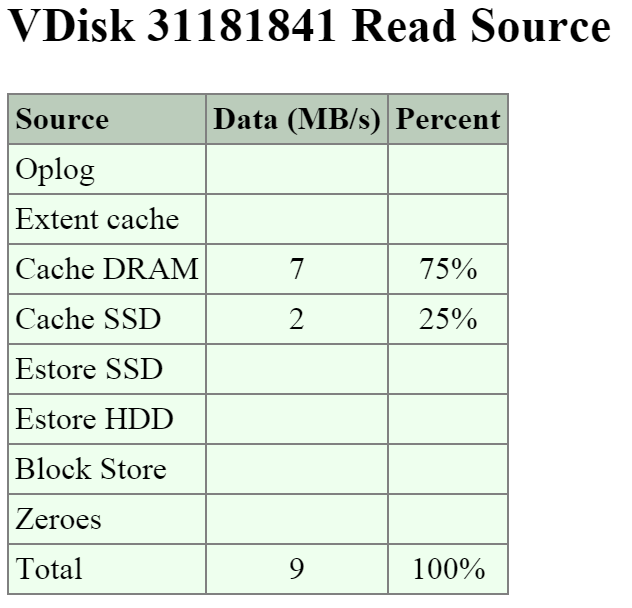 2009 Page - vDisk Stats - Read Source
If you're seeing high read latency take a look at the read source for the vDisk and take a look where the I/Os are being served from. In most cases high latency could be caused by reads coming from HDD (Estore HDD).
The ‘Write Destination’ section will show where the new write I/O are coming in to.
The figure shows the ‘Write Destination’ table:
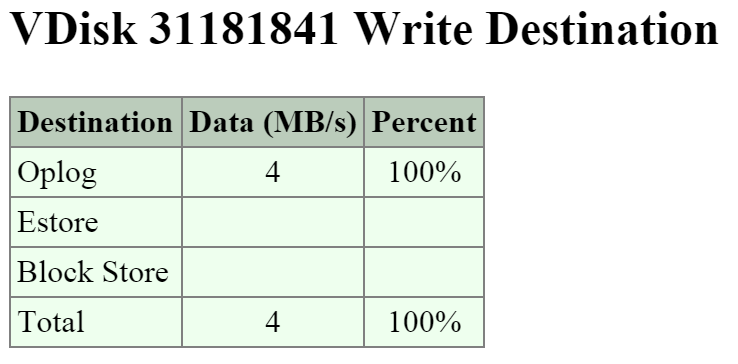 2009 Page - vDisk Stats - Write Destination
Random I/Os will be written to the Oplog, sequential I/Os will bypass the Oplog and be directly written to the Extent Store (Estore).
Another interesting data point is what data is being up-migrated from HDD to SSD via ILM. The ‘Extent Group Up-Migration’ table shows data that has been up-migrated in the last 300, 3,600 and 86,400 seconds.
The figure shows the ‘Extent Group Up-Migration’ table:
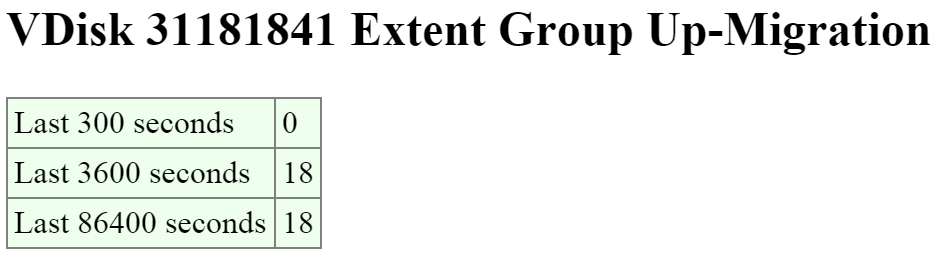 2009 Page - vDisk Stats - Extent Group Up-Migration
The 2010 page is a detailed page for monitoring the Curator MapReduce framework. This page provides details on jobs, scans, and associated tasks.
You can navigate to the Curator page by navigating to http://
The top of the page will show various details about the Curator Leader including uptime, build version, etc.
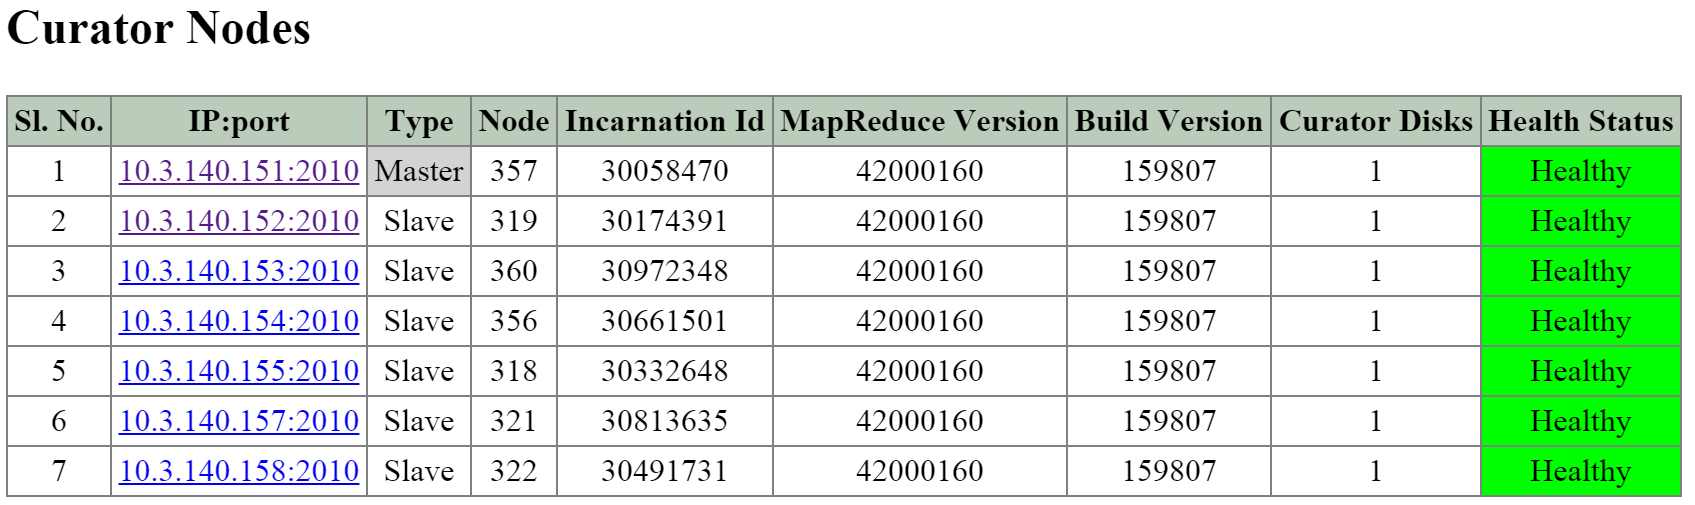
The next section is the ‘Curator Nodes’ table that shows various details about the nodes in the cluster, the roles, and health status. These will be the nodes Curator leverages for the distributed processing and delegation of tasks.
The figure shows the ‘Curator Nodes’ table:
 2010 Page - Curator Nodes
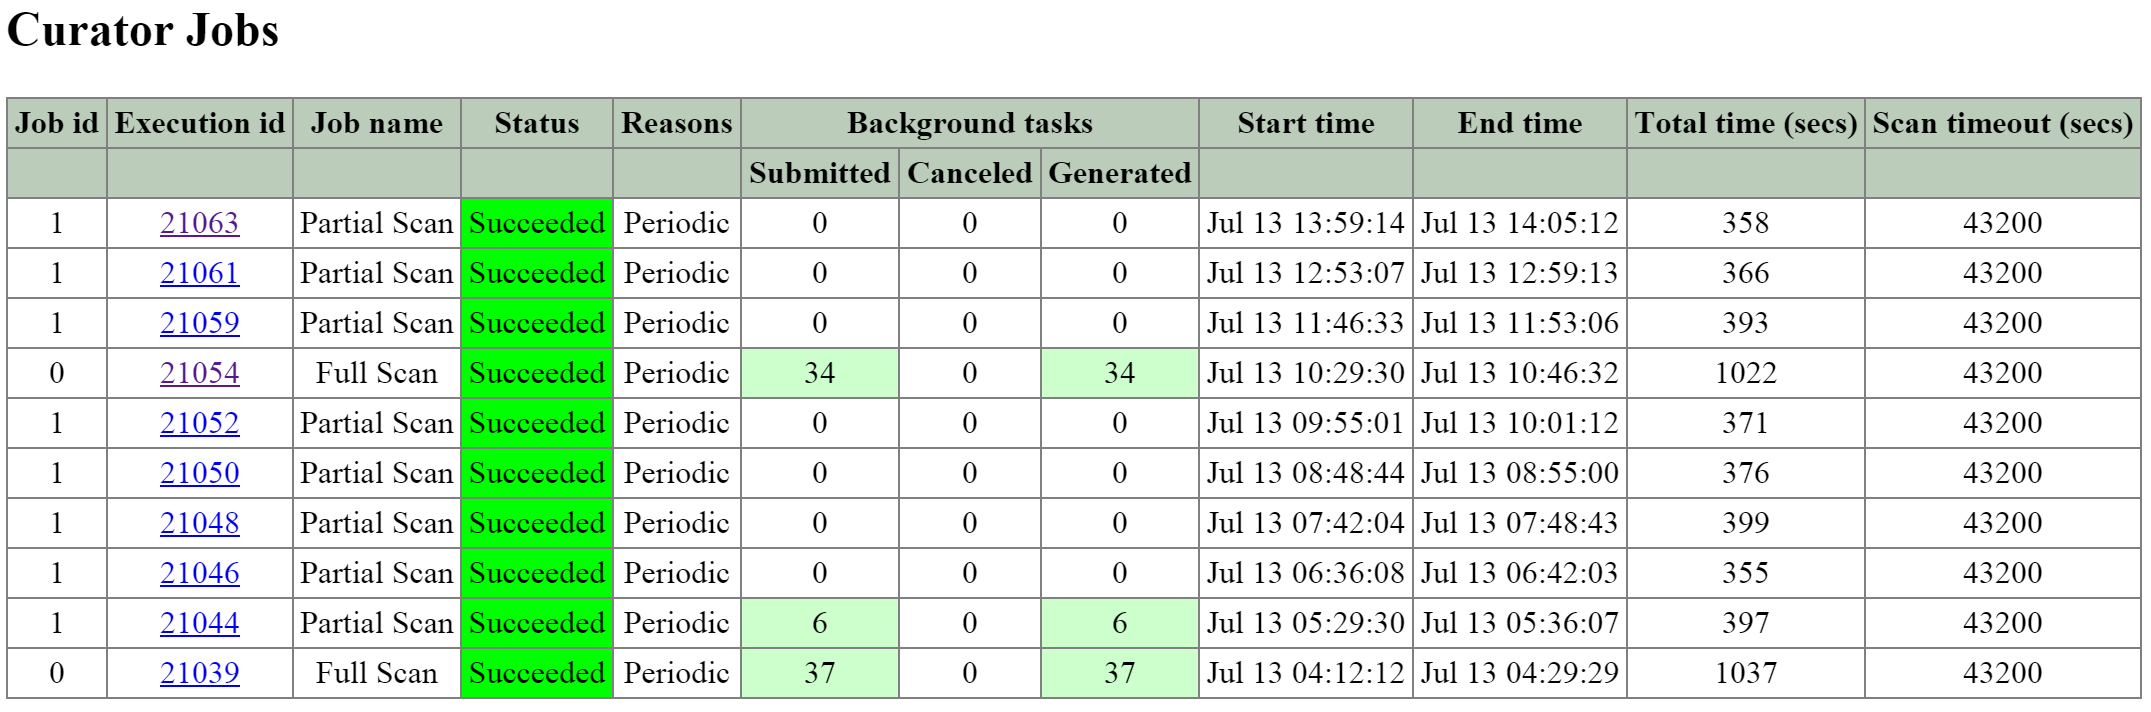
The next section is the ‘Curator Jobs’ table that shows the completed or currently running jobs.
There are two main types of jobs which include a partial scan which is eligible to run every 60 minutes and a full scan which is eligible to run every 6 hours. NOTE: the timing will be variable based upon utilization and other activities.
These scans will run on their periodic schedules however can also be triggered by certain cluster events.
Here are some of the reasons for a jobs execution:
The figure shows the ‘Curator Jobs’ table:
 2010 Page - Curator Jobs
The table shows some of the high-level activities performed by each job:
| Activity | Full Scan | Partial Scan |
|---|---|---|
| ILM | X | X |
| Disk Balancing | X | X |
| Compression | X | X |
| Deduplication | X | |
| Erasure Coding | X | |
| Garbage Cleanup | X |
Clicking on the ‘Execution id’ will bring you to the job details page which displays various job stats as well as generated tasks.
The table at the top of the page will show various details on the job including the type, reason, tasks and duration.
The next section is the ‘Background Task Stats’ table which displays various details on the type of tasks, quantity generated and priority.
The figure shows the job details table:
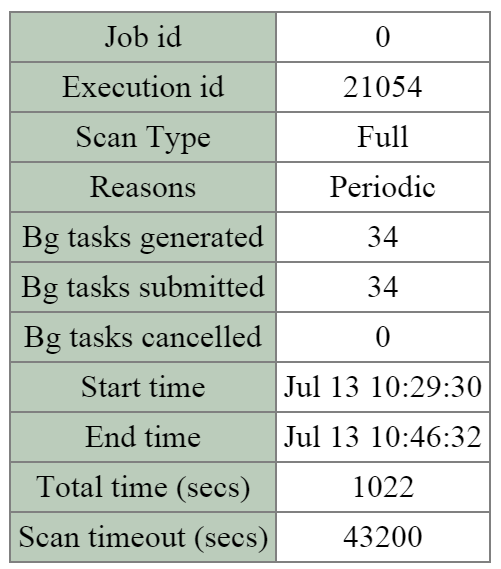 2010 Page - Curator Job - Details
The figure shows the ‘Background Task Stats’ table:
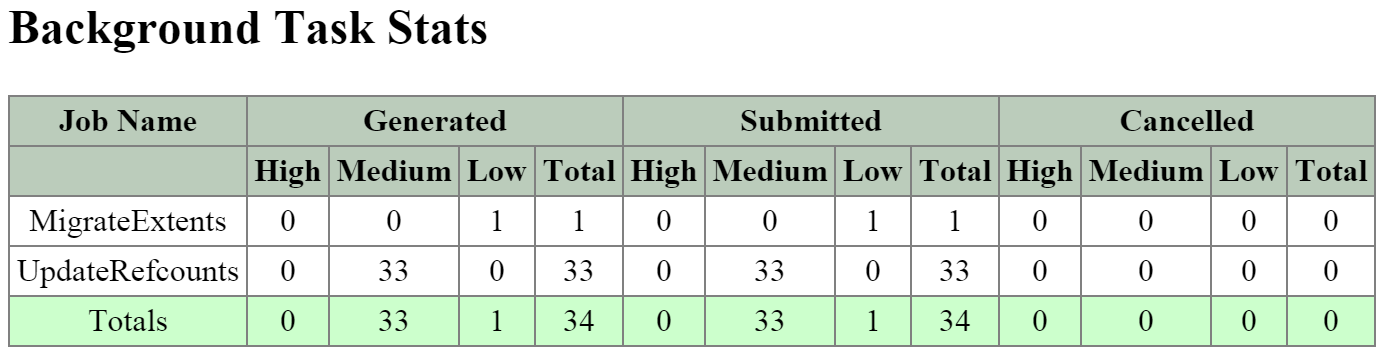 2010 Page - Curator Job - Tasks
The next section is the ‘MapReduce Jobs’ table that shows the actual MapReduce jobs started by each Curator job. Partial scans will have a single MapReduce Job, full scans will have four MapReduce Jobs.
The figure shows the ‘MapReduce Jobs’ table:
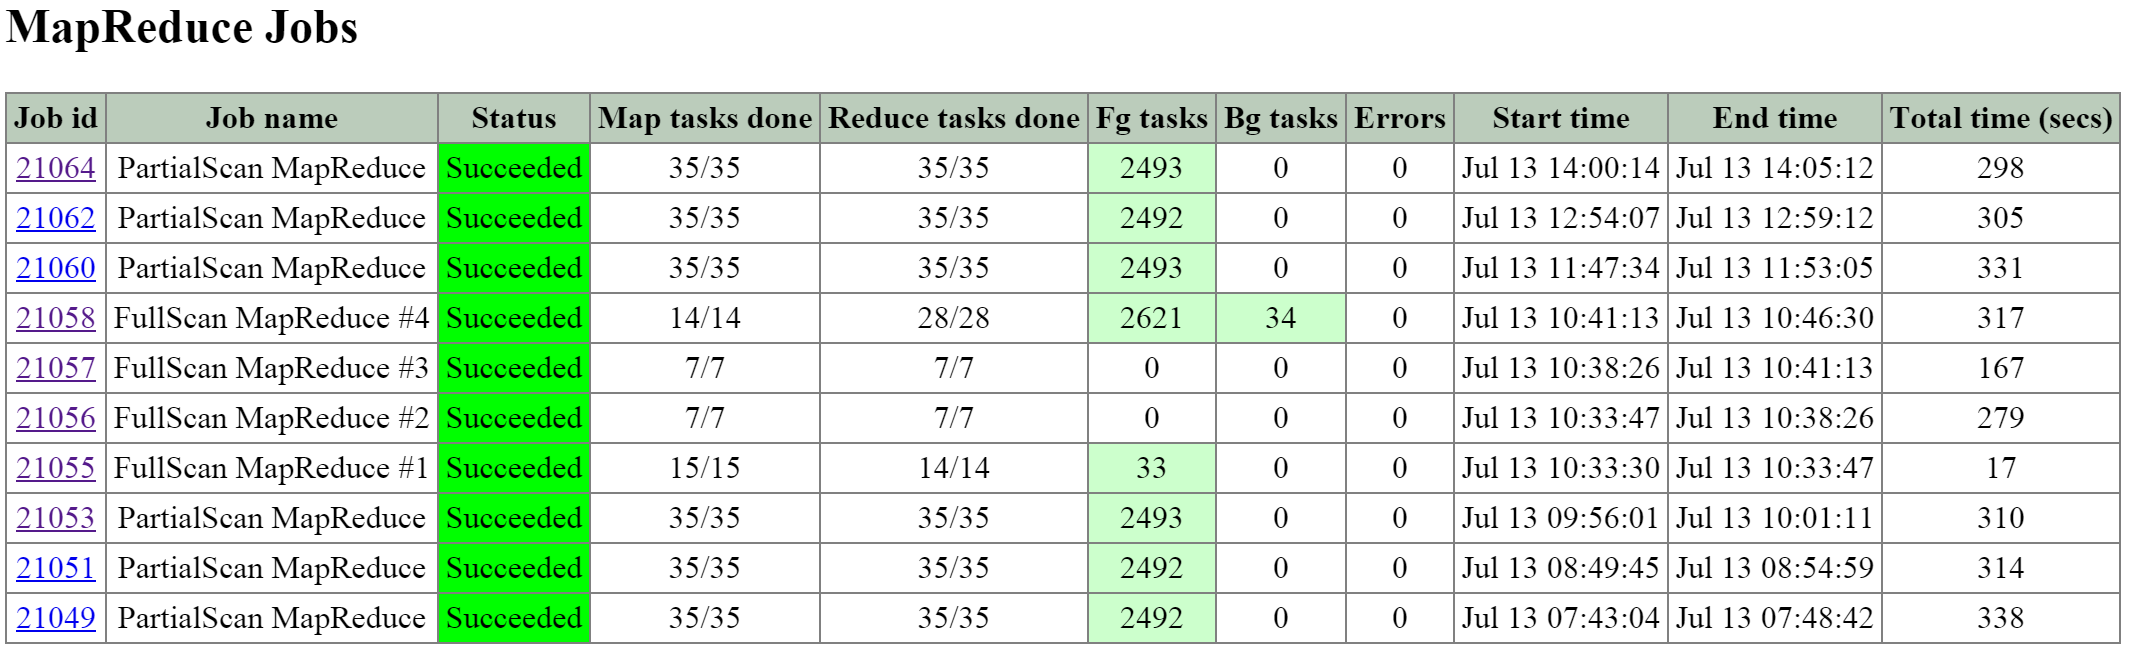 2010 Page - MapReduce Jobs
Clicking on the ‘Job id’ will bring you to the MapReduce job details page which displays the tasks status, various counters and details about the MapReduce job.
The figure shows a sample of some of the job counters:
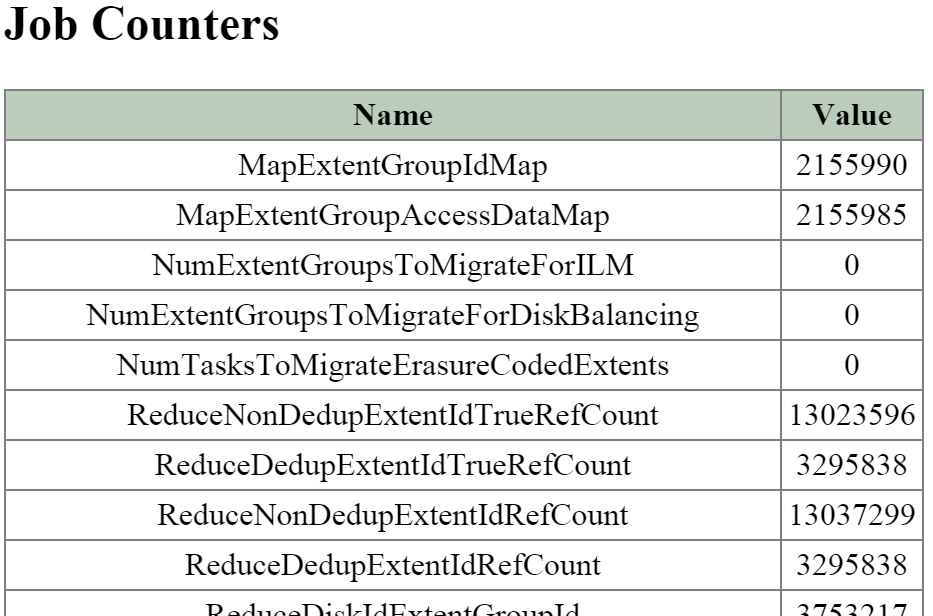 2010 Page - MapReduce Job - Counters
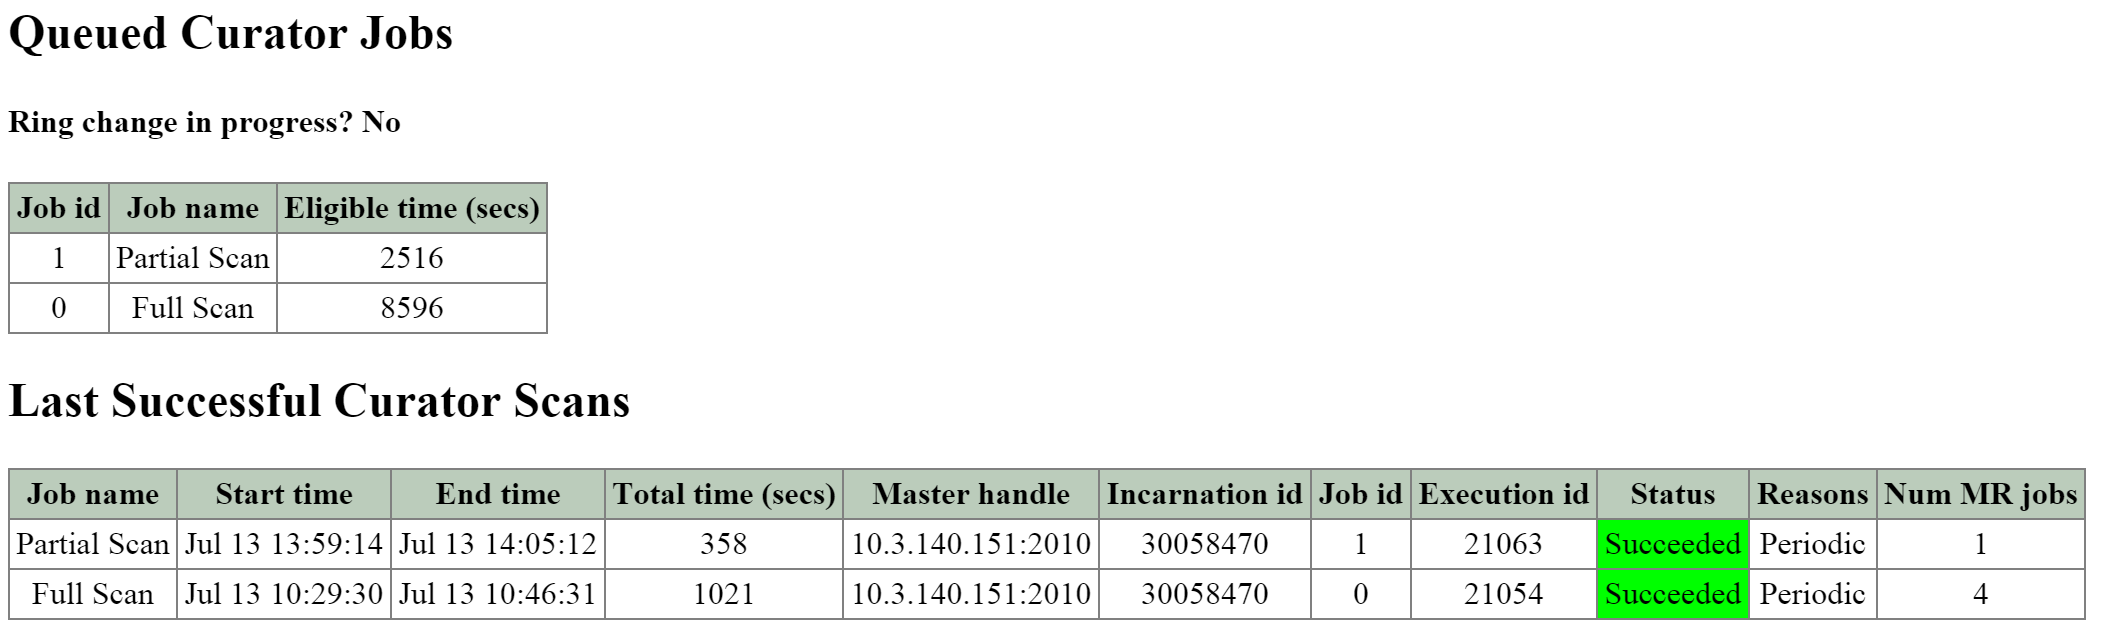
The next section on the main page is the ‘Queued Curator Jobs’ and ‘Last Successful Curator Scans’ section. These tables show when the periodic scans are eligible to run and the last successful scan’s details.
The figure shows the ’Queued Curator Jobs’ and ‘Last Successful Curator Scans’ section:
 2010 Page - Queued and Successful Scans
Prism should provide all that is necessary in terms of normal troubleshooting and performance monitoring. However, there may be cases where you want to get more detailed information which is exposed on some of the backend pages mentioned above, or the CLI.
The vdisk_config_printer command will display a list of vdisk information for all vdisk on the cluster.
I’ve highlighted some of the important fields below:
The following shows example command output:
nutanix@NTNX-13SM35210012-A-CVM:~$ vdisk_config_printer | more
...
vdisk_id: 1014400
vdisk_name: "NFS:1314152"
parent_vdisk_id: 16445
vdisk_size: 40000000000
container_id: 988
to_remove: true
creation_time_usecs: 1414104961926709
mutability_state: kImmutableSnapshot
closest_named_ancestor: "NFS:852488"
vdisk_creator_loc: 7
vdisk_creator_loc: 67426
vdisk_creator_loc: 4420541
nfs_file_name: "d12f5058-f4ef-4471-a196-c1ce8b722877"
may_be_parent: true
parent_nfs_file_name_hint: "d12f5058-f4ef-4471-a196-c1ce8b722877"
last_modification_time_usecs: 1414241875647629
...
The vdisk_usage_printer is used to get detailed information for a vdisk, its extents and egroups.
I’ve highlighted some of the important fields below:
The following shows example command output:
nutanix@NTNX-13SM35210012-A-CVM:~$ vdisk_usage_printer -vdisk_id=99999
 Egid # eids UT Size T Size ... T Type Replicas(disk/svm/rack)
 1256878 64 1.03 MB 1.03 MB ... D,[73 /14/60][184108644/184108632/60]
 1256881 64 1.03 MB 1.03 MB ... D,[73 /14/60][152/7/25]
 1256883 64 1.00 MB 1.00 MB ... D,[73 /14/60][184108642/184108632/60]
 1055651 4 4.00 MB 4.00 MB ... none[76 /14/60][184108643/184108632/60]
 1056604 4 4.00 MB 4.00 MB ... none[74 /14/60][184108642/184108632/60]
 1056605 4 4.00 MB 4.00 MB ... none[73 /14/60][152/7/25]
 ...
NOTE: Notice the egroup size for deduped vs. non-deduped egroups (1 vs. 4MB). As mentioned in the ‘Data Structure’ section, for deduped data, a 1MB egroup size is preferred to negate any potential fragmention cause by de-duplicating the data.
The curator_cli display_data_reduction_report is used to get detailed information on the storage savings per container by transform (e.g. clone, snap, dedup, compression, erasure coding, etc.)
I’ve highlighted some of the important fields below:
The following shows example command output:
CVM:~$ curator_cli display_data_reduction_report
Using curator leader: 99.99.99.99:2010
Using execution id 68188 of the last successful full scan
+---------------------------------------------------------------------------+
| Container| Technique | Pre | Post | Saved | Ratio |
| Id | | Reduction | Reduction | | |
+---------------------------------------------------------------------------+
| 988 | Clone | 4.88 TB | 2.86 TB | 2.02 TB | 1.70753 |
| 988 | Snapshot | 2.86 TB | 2.22 TB | 656.92 GB | 1.28931 |
| 988 | Dedup | 2.22 TB | 1.21 TB | 1.00 TB | 1.82518 |
| 988 | Compression | 1.23 TB | 1.23 TB | 0.00 KB | 1 |
| 988 | Erasure Coding | 1.23 TB | 1.23 TB | 0.00 KB | 1 |
| 26768753 | Clone | 764.26 GB | 626.25 GB | 138.01 GB | 1.22038 |
| 26768753 | Snapshot | 380.87 GB | 380.87 GB | 0.00 KB | 1 |
| 84040 | Snappy | 810.35 GB | 102.38 GB | 707.97 GB | 7.91496 |
| 6853230 | Snappy | 3.15 TB | 1.09 TB | 2.06 TB | 2.88713 |
| 12199346 | Snappy | 872.42 GB | 109.89 GB | 762.53 GB | 7.93892 |
| 12736558 | Snappy | 9.00 TB | 1.13 TB | 7.87 TB | 7.94087 |
| 15430780 | Snappy | 1.23 TB | 89.37 GB | 1.14 TB | 14.1043 |
| 26768751 | Snappy | 339.00 MB | 45.02 MB | 293.98 MB | 7.53072 |
| 27352219 | Snappy | 1013.8 MB | 90.32 MB | 923.55 MB | 11.2253 |
+---------------------------------------------------------------------------+
The curator_cli get_vdisk_usage lookup_vdisk_ids command is used to get various stats about the space used by each of the specified vdisks.
I’ve highlighted some of the important fields below:
The following shows example command output:
Using curator leader: 99.99.99.99:2010
VDisk usage stats:
+------------------------------------------------------------------------+
| VDisk Id | Exclusive | Logical | Logical | Logical | Logical |
| | usage | Uninherited | Dedup | Snapshot | Clone |
+------------------------------------------------------------------------+
| 254244142 | 596.06 MB | 529.75 MB | 6.70 GB | 11.55 MB | 214 MB |
| 15995052 | 599.05 MB | 90.70 MB | 7.14 GB | 0.00 KB | 4.81 MB |
| 203739387 | 31.97 GB | 31.86 GB | 24.3 MB | 0.00 KB | 4.72 GB |
| 22841153 | 147.51 GB | 147.18 GB | 0.00 KB | 0.00 KB | 0.00 KB |
...
The curator_cli get_egroup_access_info is used to get detailed information on the number of egroups in each bucket based upon last access (read) / modify ([over]write). This information can be used to estimate the number of egroups which might be eligible candidates to leverage erasure coding.
I’ve highlighted some of the important fields below:
The following shows example command output:
Using curator leader: 99.99.99.99:2010
Container Id: 988
+----------------------------------------------------------------------------..
| Access \ Modify (secs) | [0,300) | [300,3600) | [3600,86400) | [86400,60480..
+----------------------------------------------------------------------------..
| [0,300) | 345 | 1 | 0 | 0 ..
| [300,3600) | 164 | 817 | 0 | 0 ..
| [3600,86400) | 4 | 7 | 3479 | 7 ..
| [86400,604800) | 0 | 0 | 81 | 7063 ..
| [604800,2592000) | 0 | 0 | 15 | 22 ..
| [2592000,15552000) | 1 | 0 | 0 | 10 ..
| [15552000,inf) | 0 | 0 | 0 | 1 ..
+----------------------------------------------------------------------------..
...
©2025 Nutanix, Inc. All rights reserved. Nutanix, the Nutanix logo and all Nutanix product and service names mentioned are registered trademarks or trademarks of Nutanix, Inc. in the United States and other countries. All other brand names mentioned are for identification purposes only and may be the trademarks of their respective holder(s).